Creating a graphic HMI for Mervis SCADA
HMI (Human-Machine Interface) templates are used to easily control and monitor one or more devices. Graphic HMI interfaces are designed for web browsers, allowing you to monitor the status of automation processes and to control them. The easiest variant of an HMI is a local web template for a PLC. Alternatives are terminal graphic templates for the Mervis SCADA or for an external webserver.
Patron
Neuron
Gate
Unipi 1.1
Axon
Prerequisites:
- Existing Mervis IDE project created according to the Creating a Mervis SCADA project tutorial
- All prerequisites from the mentioned tutorial
Graphic HMI variant for Mervis SCADA is available only via a web interface, as the Mervis mobile app currently does not support it. It is thus necessary to connect all data points used in this tutorial to the data point table as well.
Creating a template
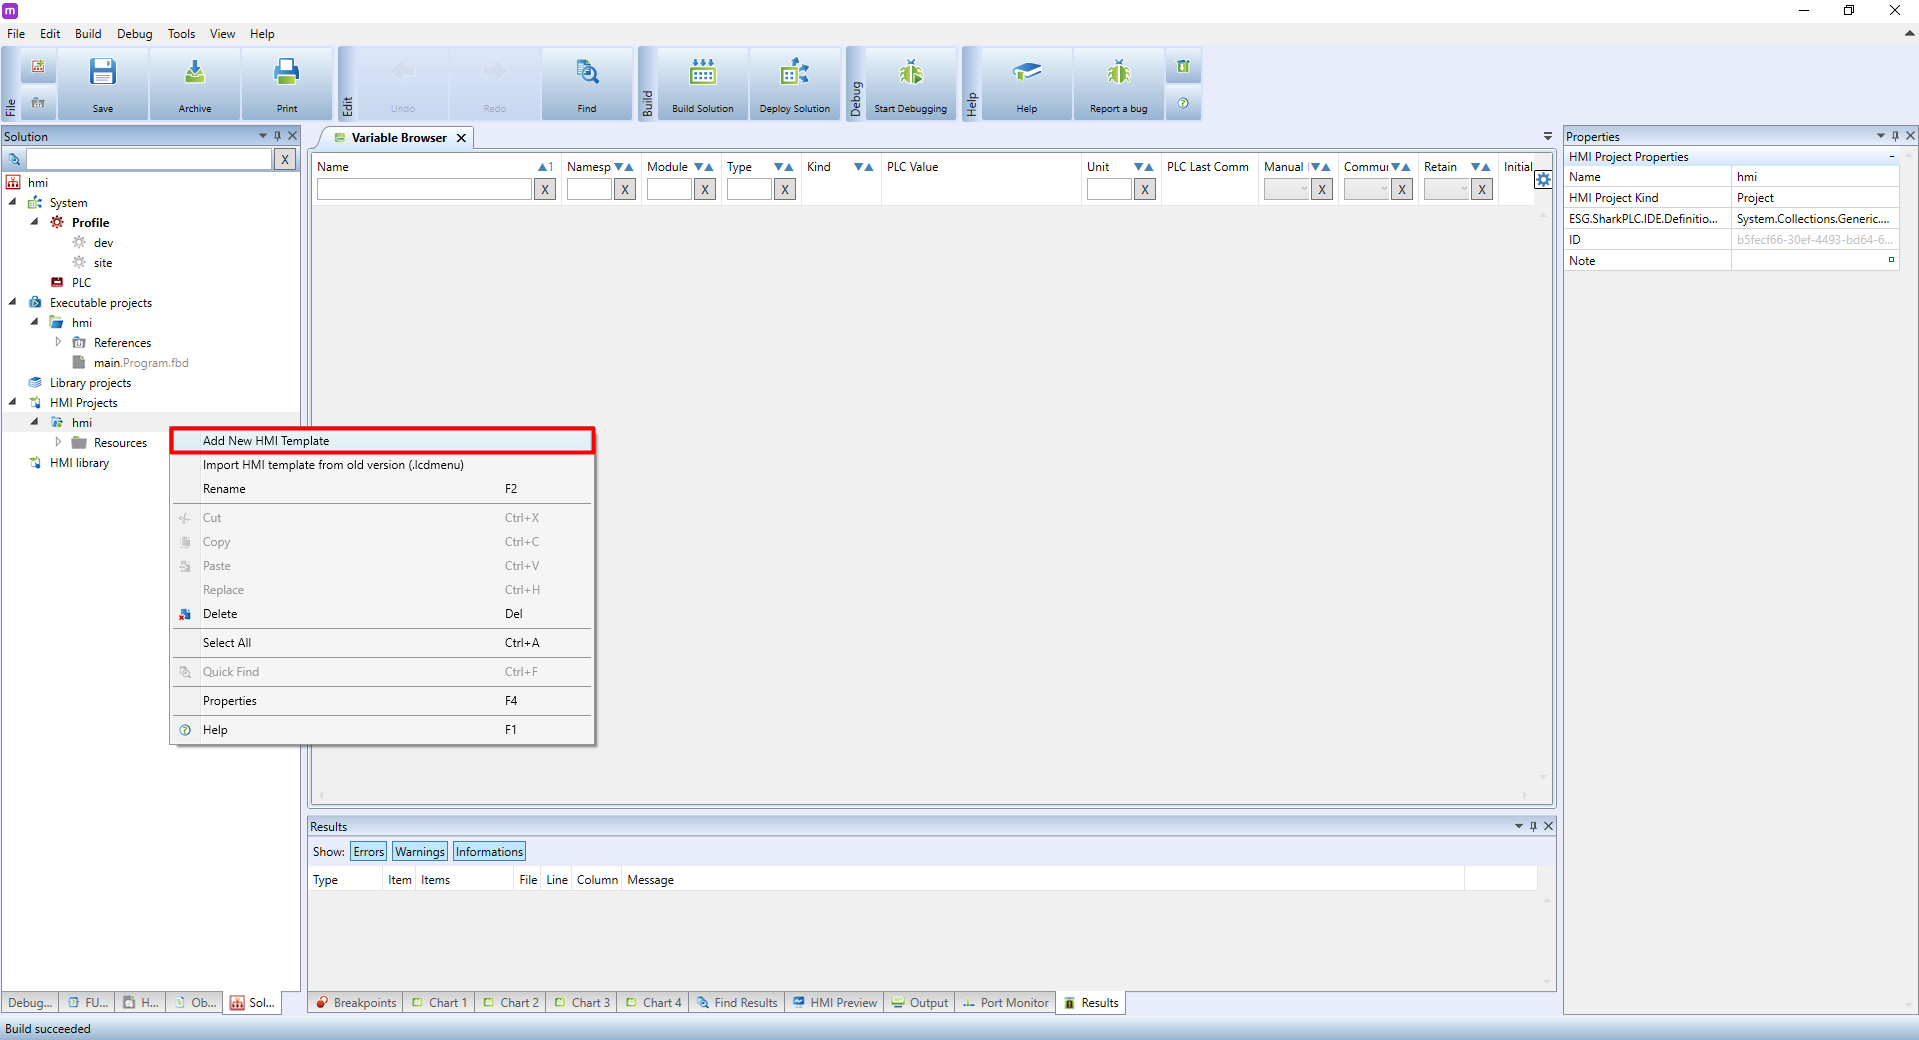
You can create a HMI template by right-clicking on HMI project and selecting Add New HMI Template
A dialogue window will appear. Enter the name of the template and set other properties as needed.
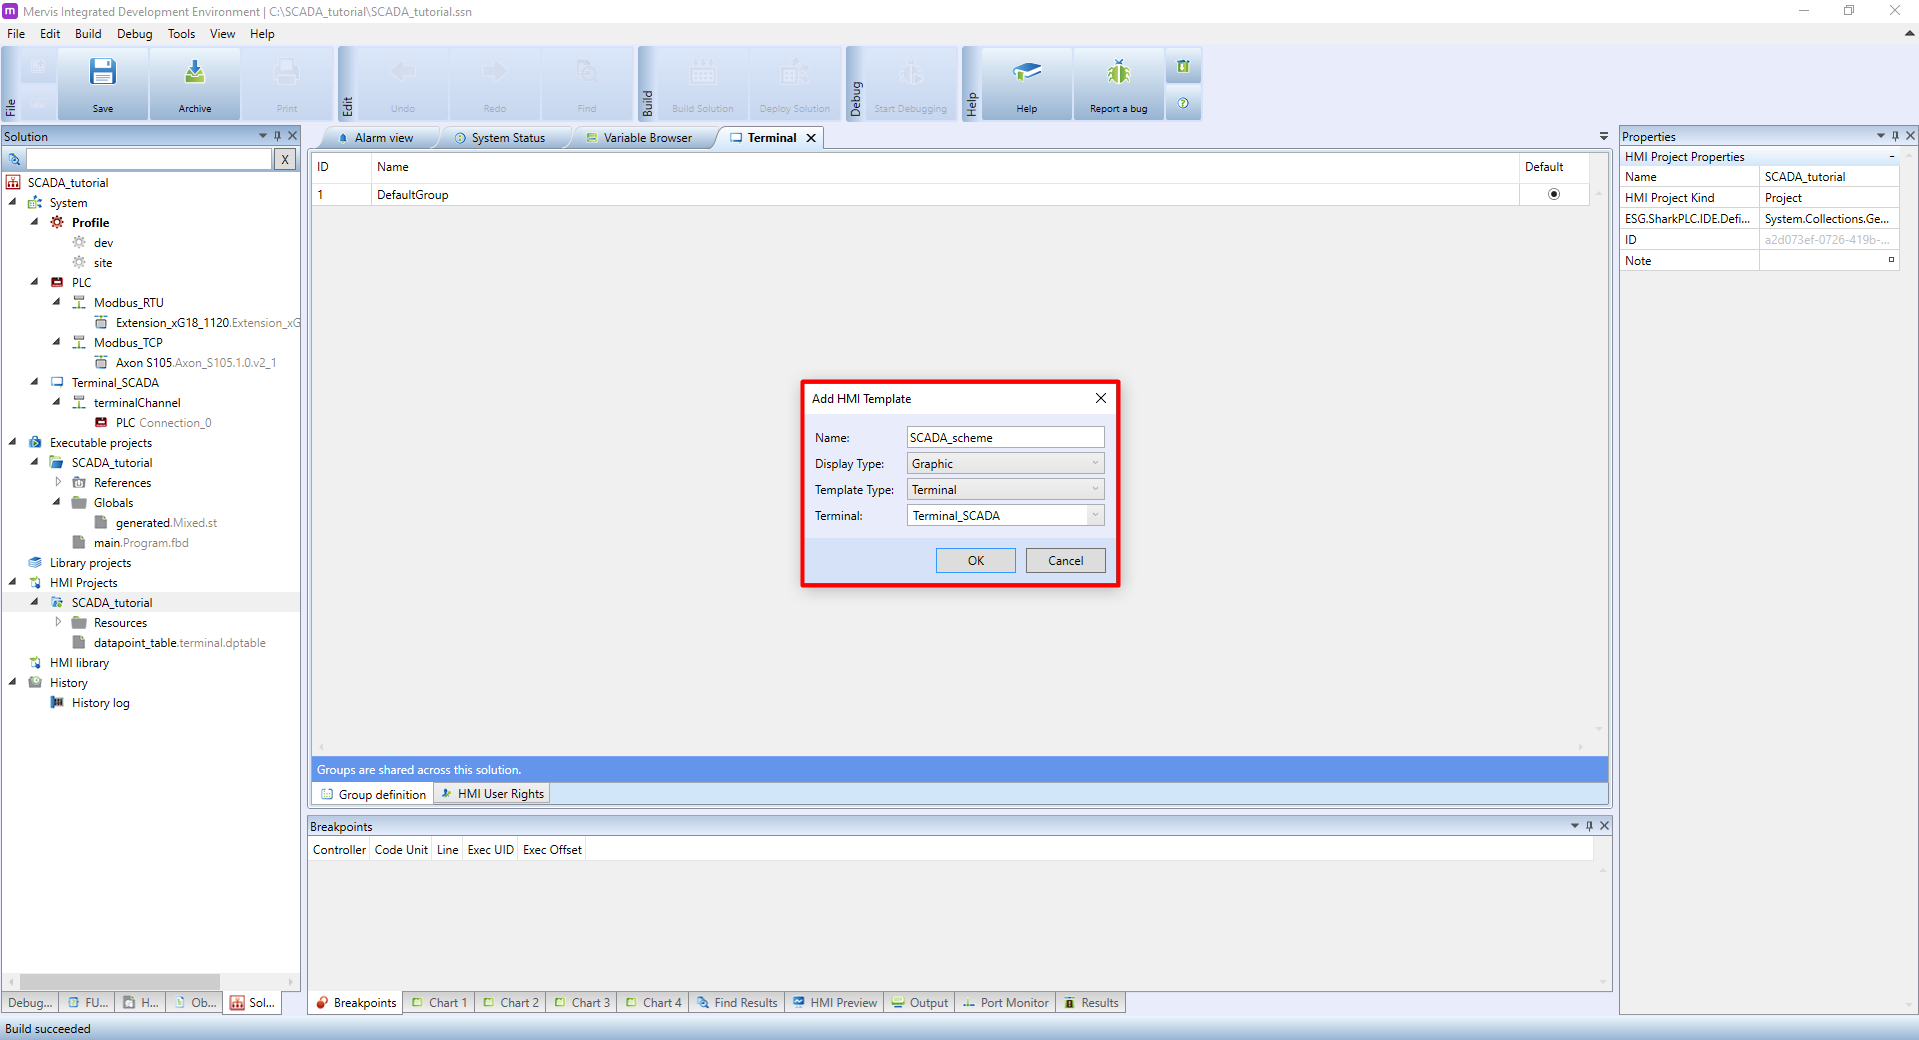
- Name should be considered carefully, we also recommend to use a prefix separated by underscore, ie. SCADA_schema.
- Display Type determines the template type → select Graphic
- Template Type - choose a Terminal
- Terminal - choose terminal the template is created for
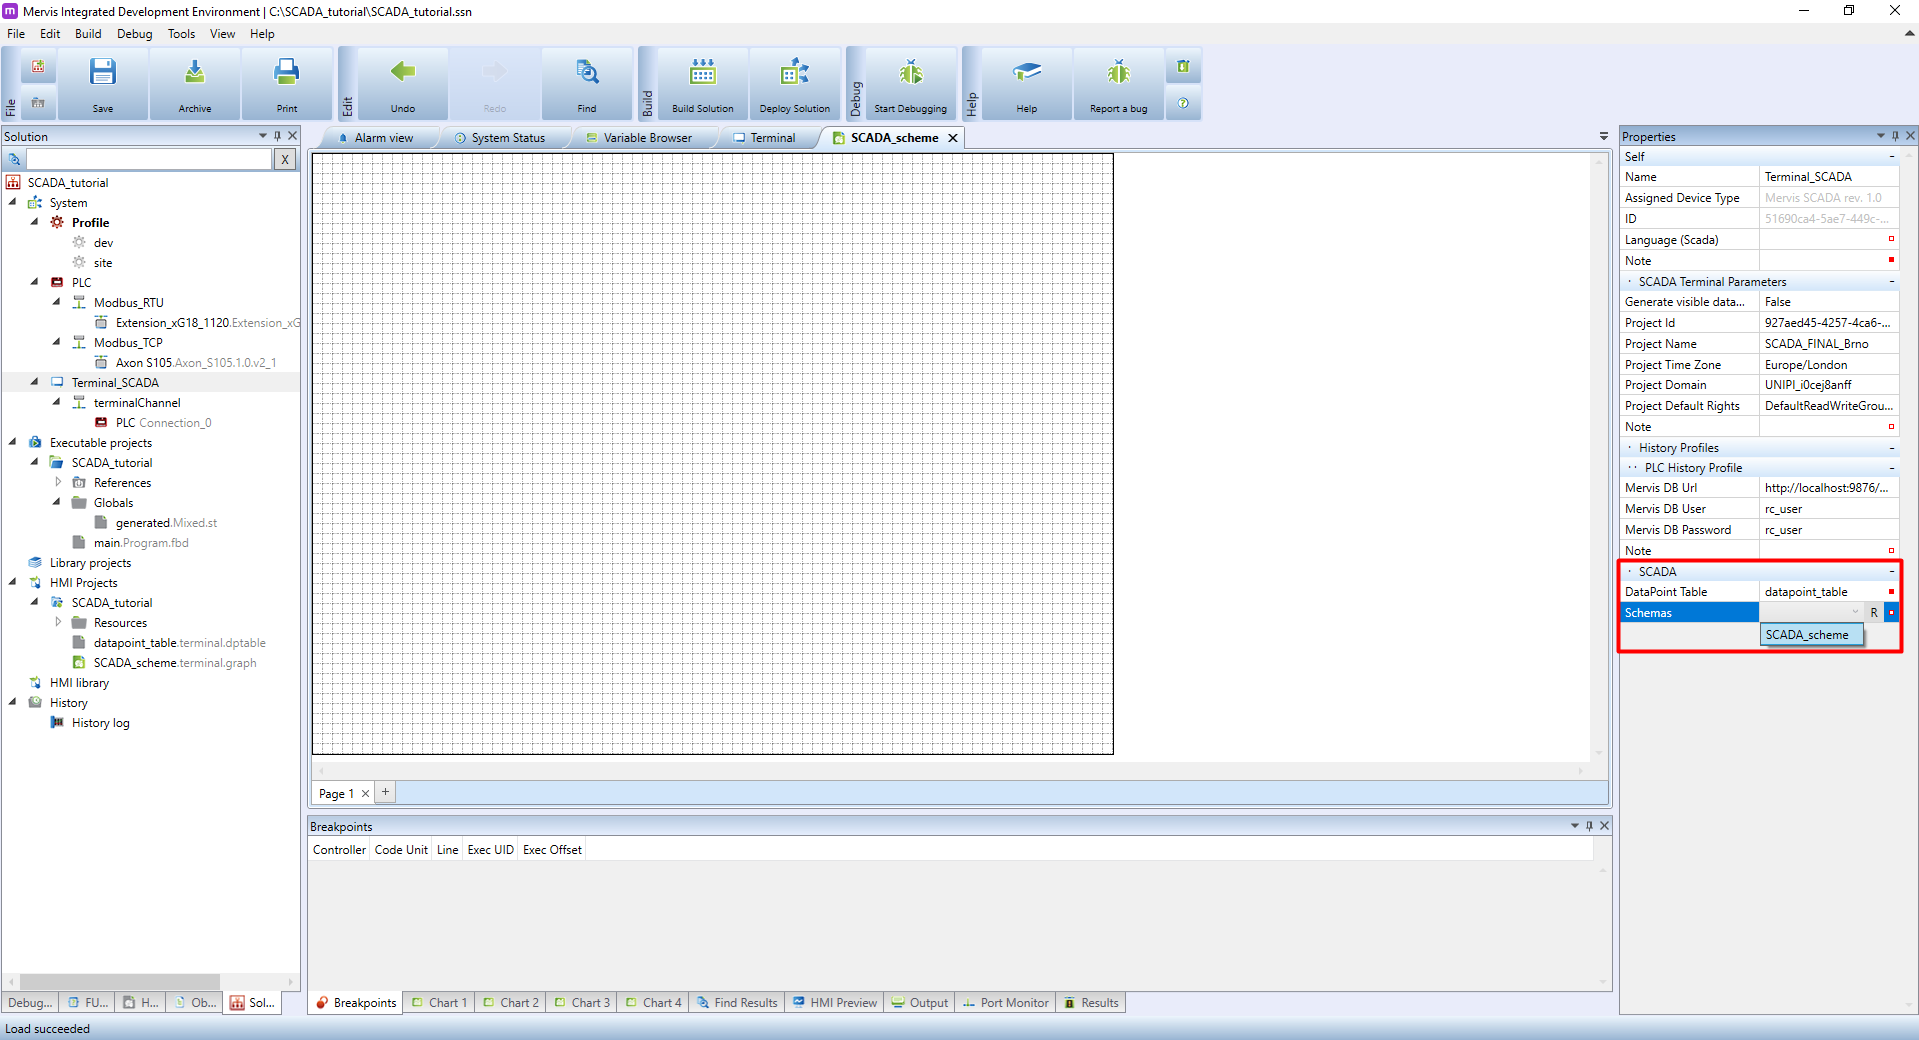
You now need to assign the template to the terminal. Click on the terminal and look for Schemas in its properties in the right column. Here you need to insert the template you created in the previous steps.
Creating a HMI
All data points (variables) used in the graphic HMI also need to be connected to a data point table and, by extension, to the Mervis DB as well.
In the left panel, double-click on the created HMI template. On the bottomn of this panel, switch to HMI Objects tab - your screen should look like this afterwards:
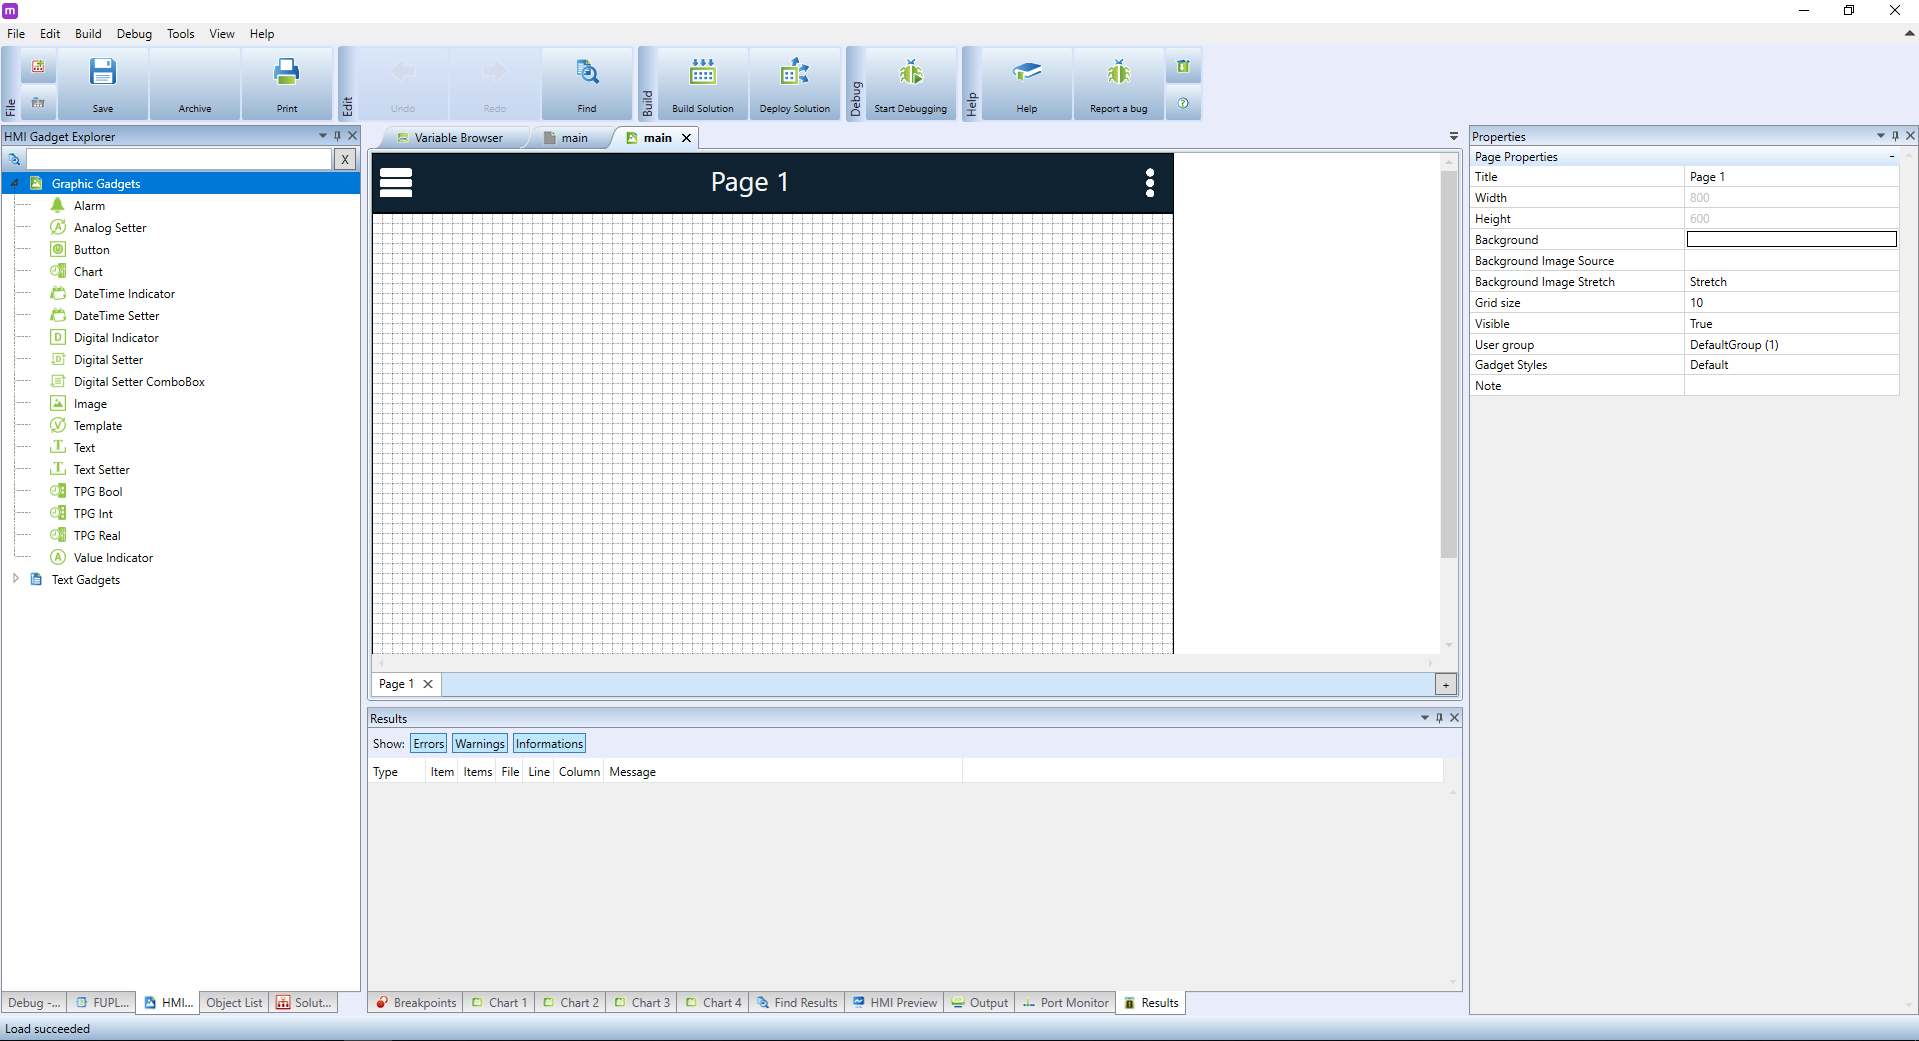
In the HMI objects window you can see a wide collection of graphic gadgets that can be added to the template. In this tutorial, we will start with the Value Indicator element designed for displaying numeric values. This makes it ideal for displaying the current temperature in an office, for example. Click on the element in the left panel and drag it onto the main panel.
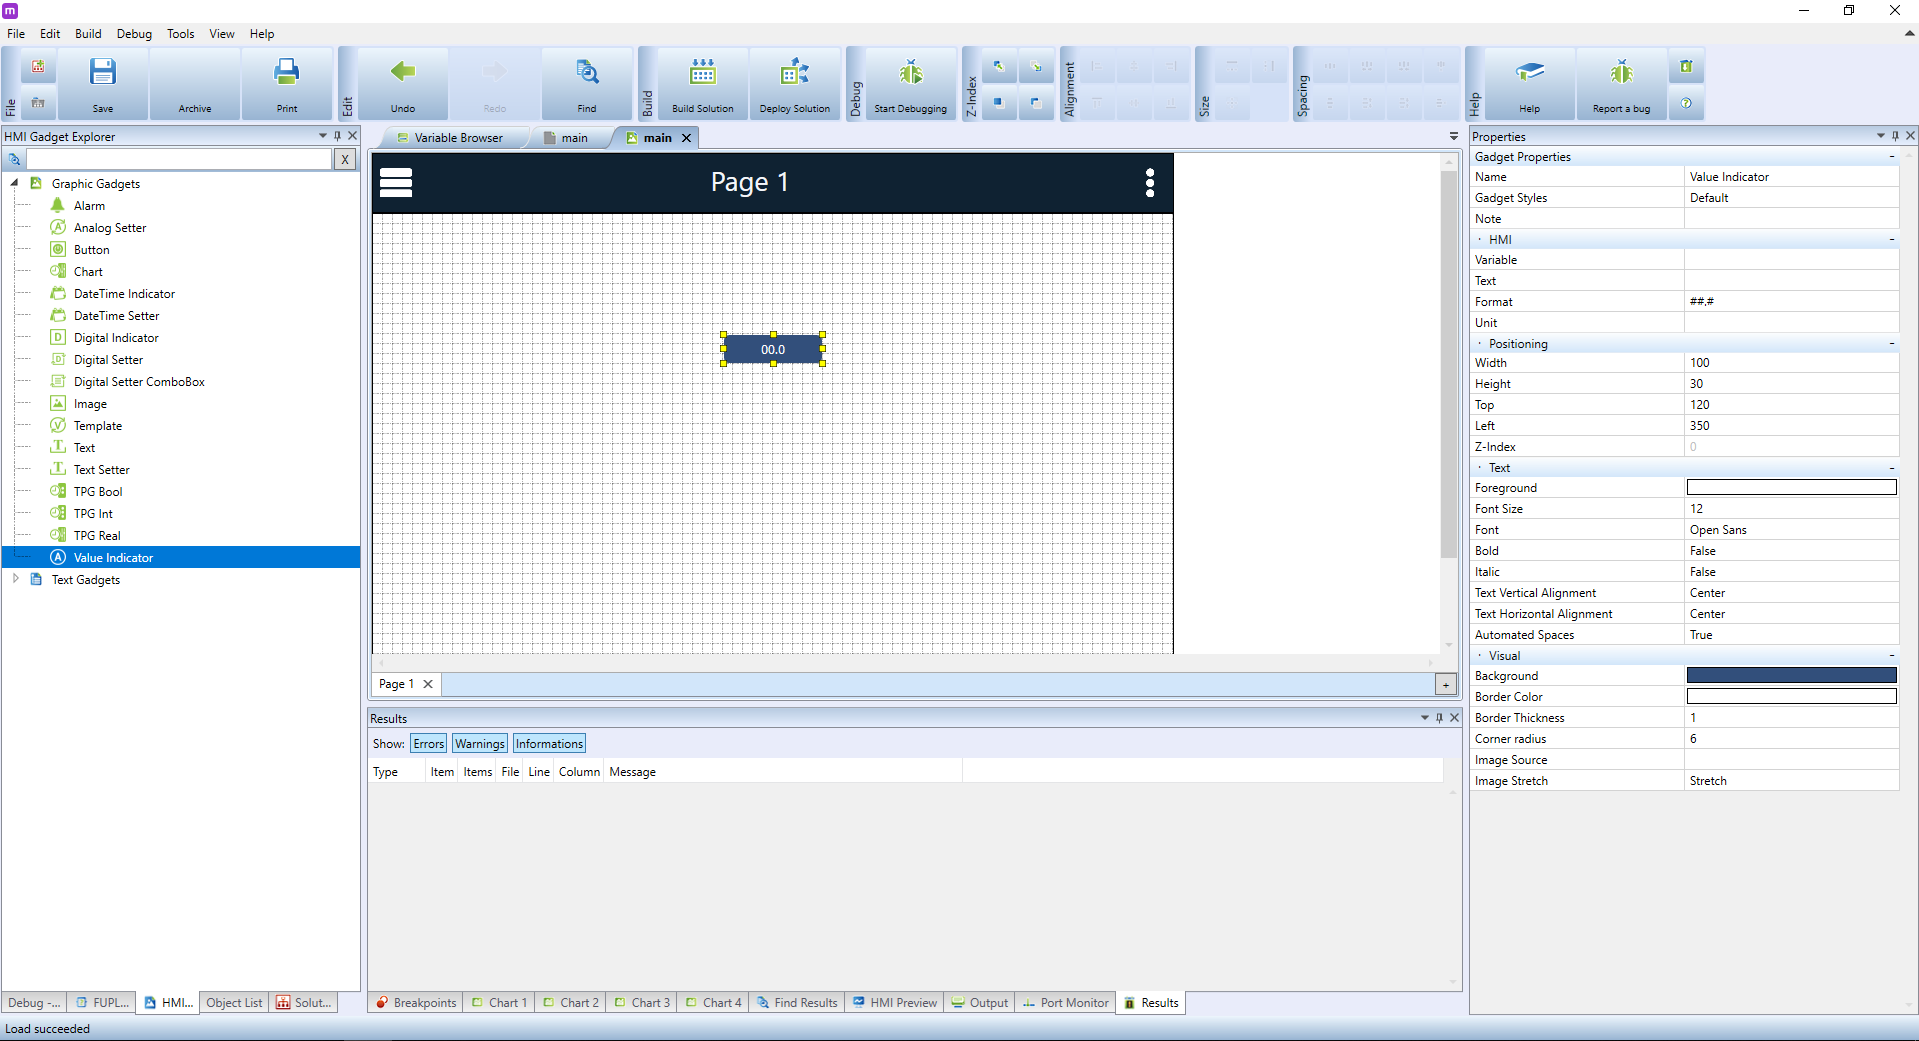
The element will appear on the main panel and will stay highlighted. In the Properties menu, you can now see all available configurations for it. Right now, the most important attribute is Variable placed in the HMI section. Using this setting we will tell the element which variable will be used as a data source. Click on Variable and then click on the button.  .
.

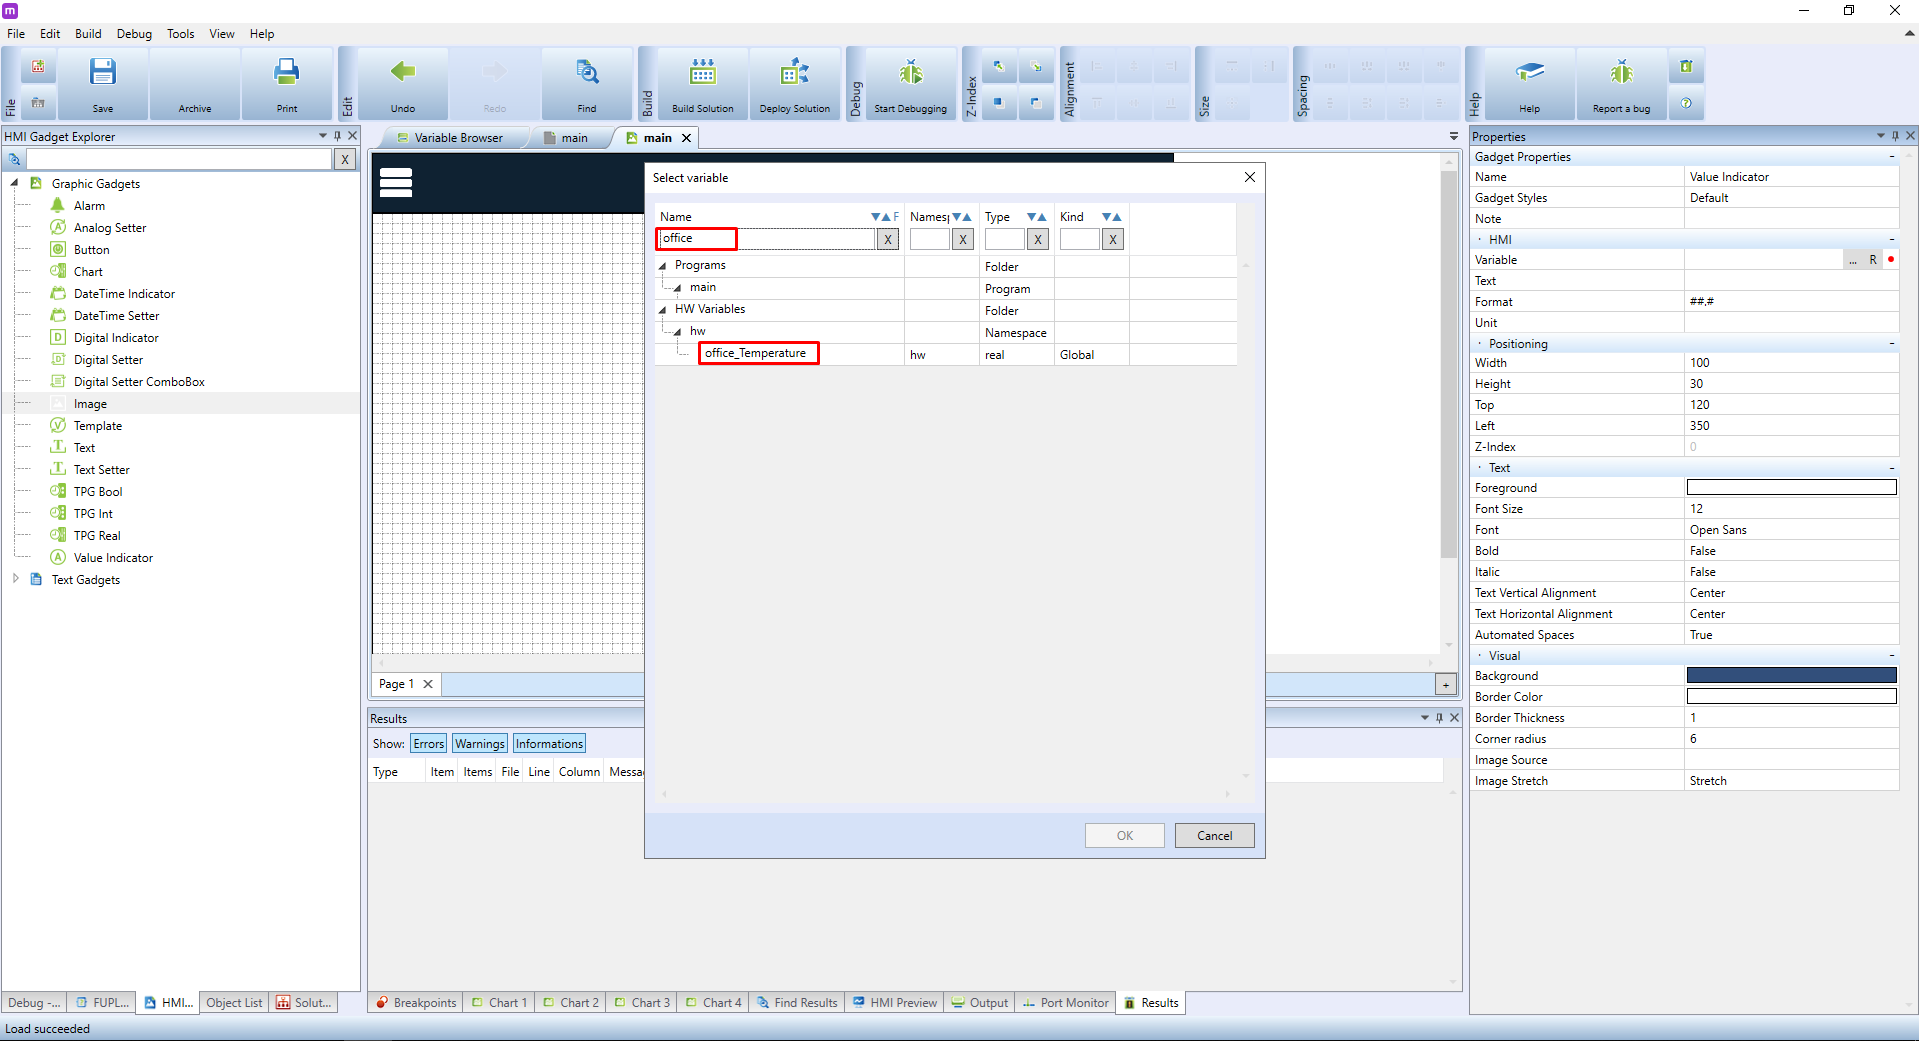
A well-known Select variable dialogue will appear, in which you can search for the needed variable. In this tutorial, we are looking for an already existing office_temperature variable. Look it up, select it from the list and confirm by clicking on OK.
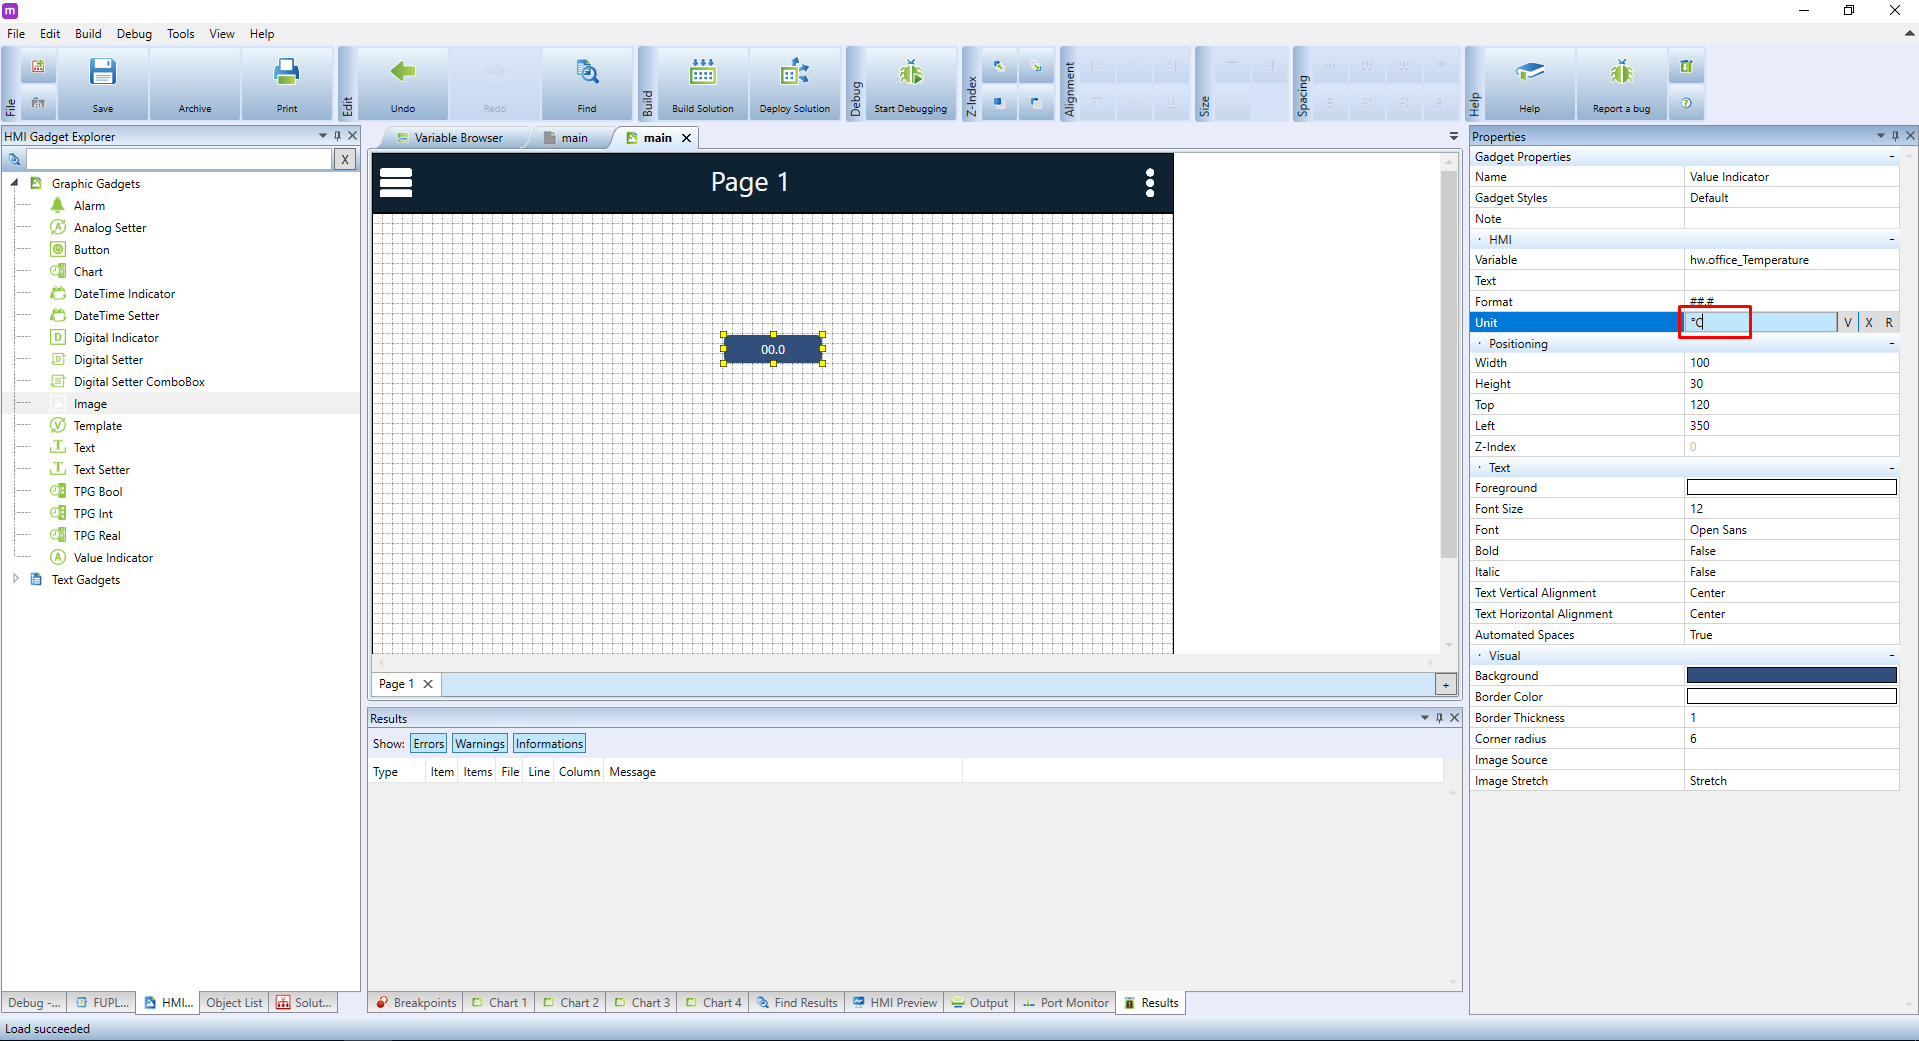
Go back to Properties. Change the Unit setting determining the displayed value's unit. In the HMI, this unit will be automatically added behind the displayed values. As we are talking about a temperature value, set the Unit attribute to °C.
It may be also handy to give the value a suitable name. In the HMI objects menu choose the Text element and place it into the template. In the Properties panel, change the Text attribute to Current temperature.
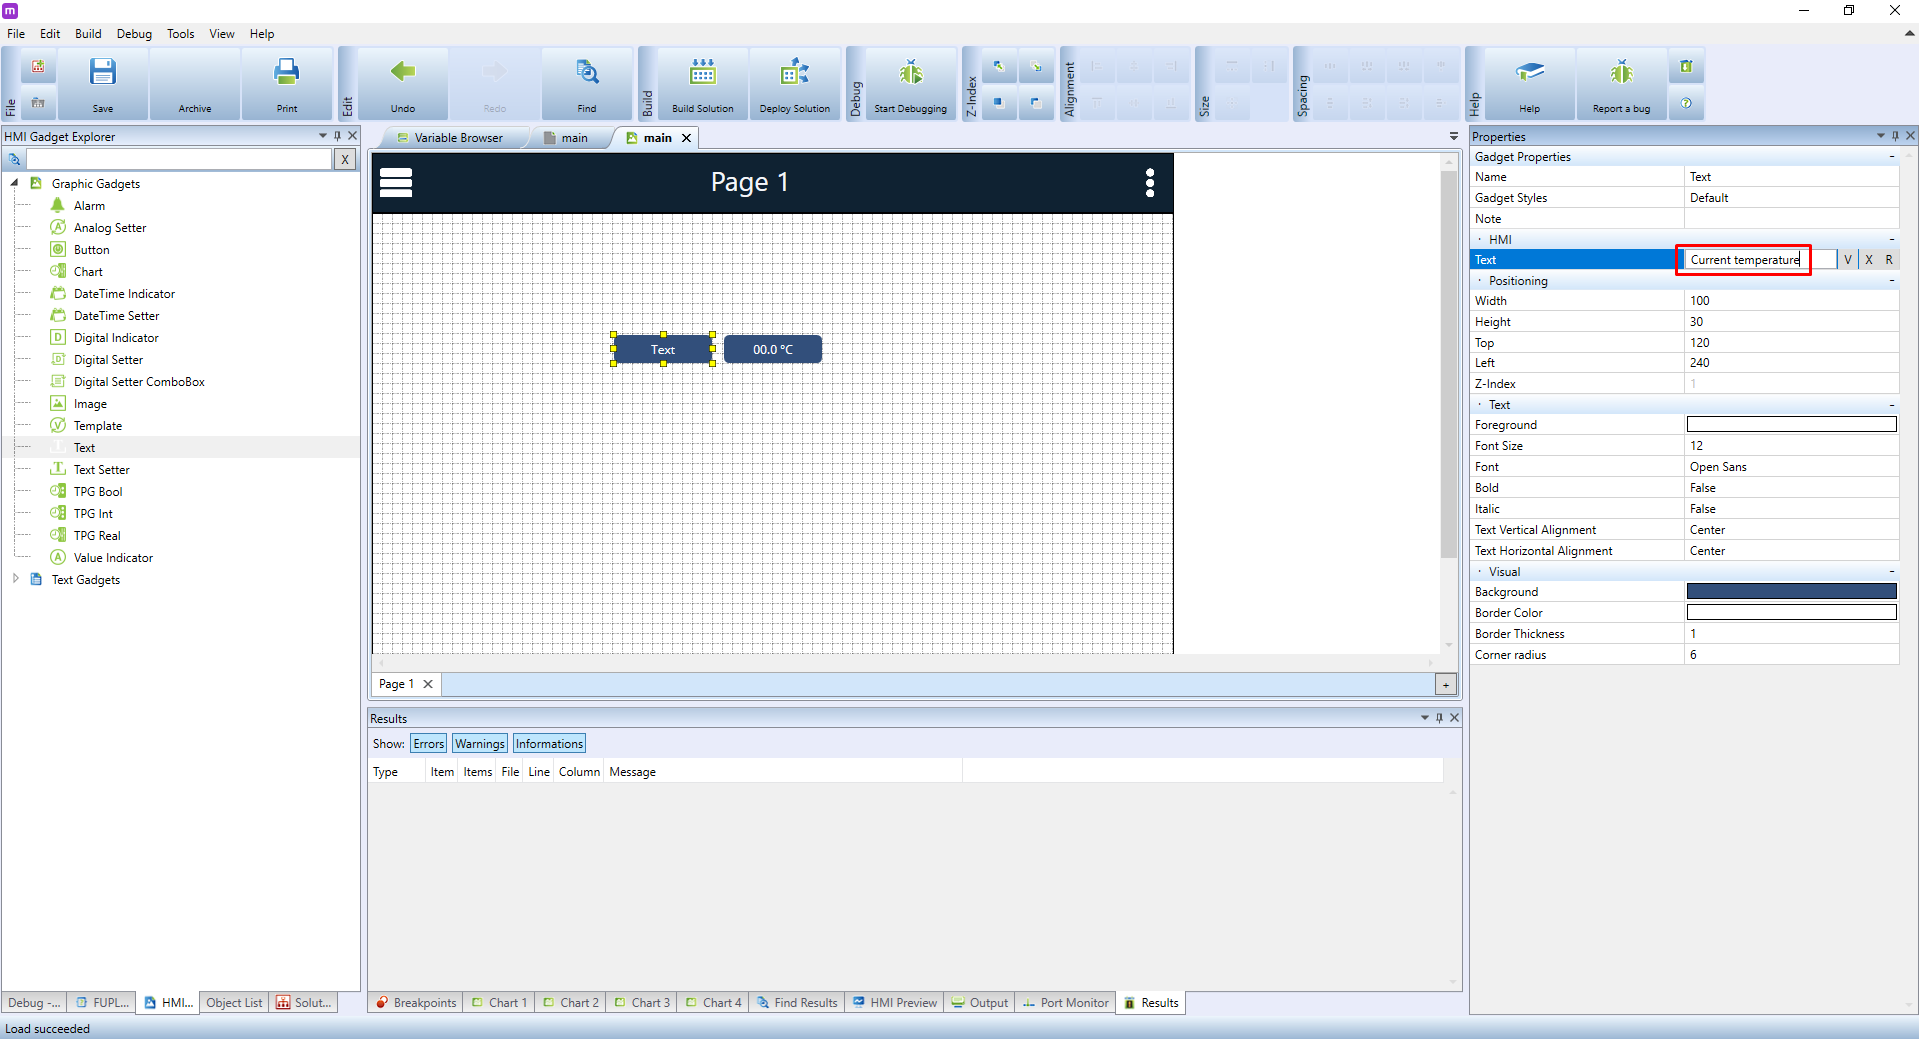
As the new name is much longer than the default one, you can enlarge the text field by dragging one of the yellow squares around the element to make the whole text visible.
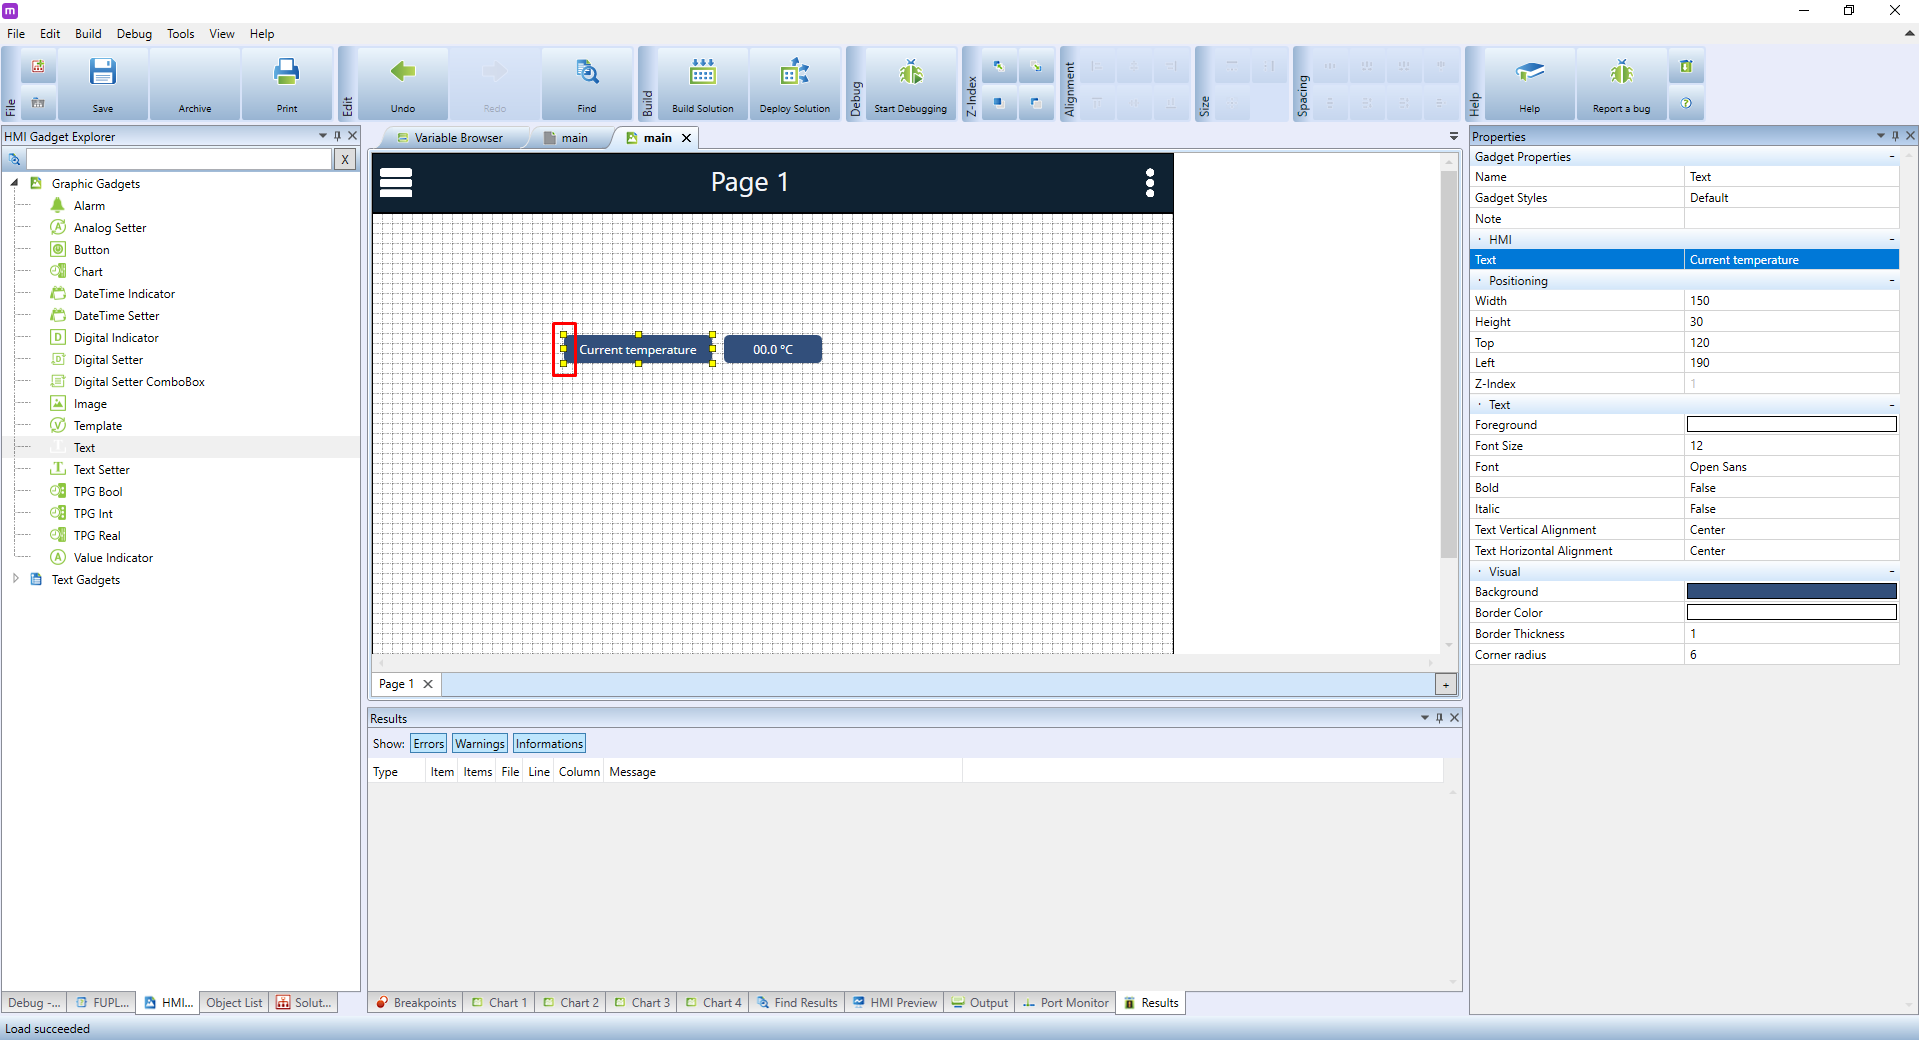
Right now, the element is not legible enough, and its current design makes it look more like a button than a nametag. Let's improve it by changing the text's colour to blue using the Foreground attribute in the Text property section.

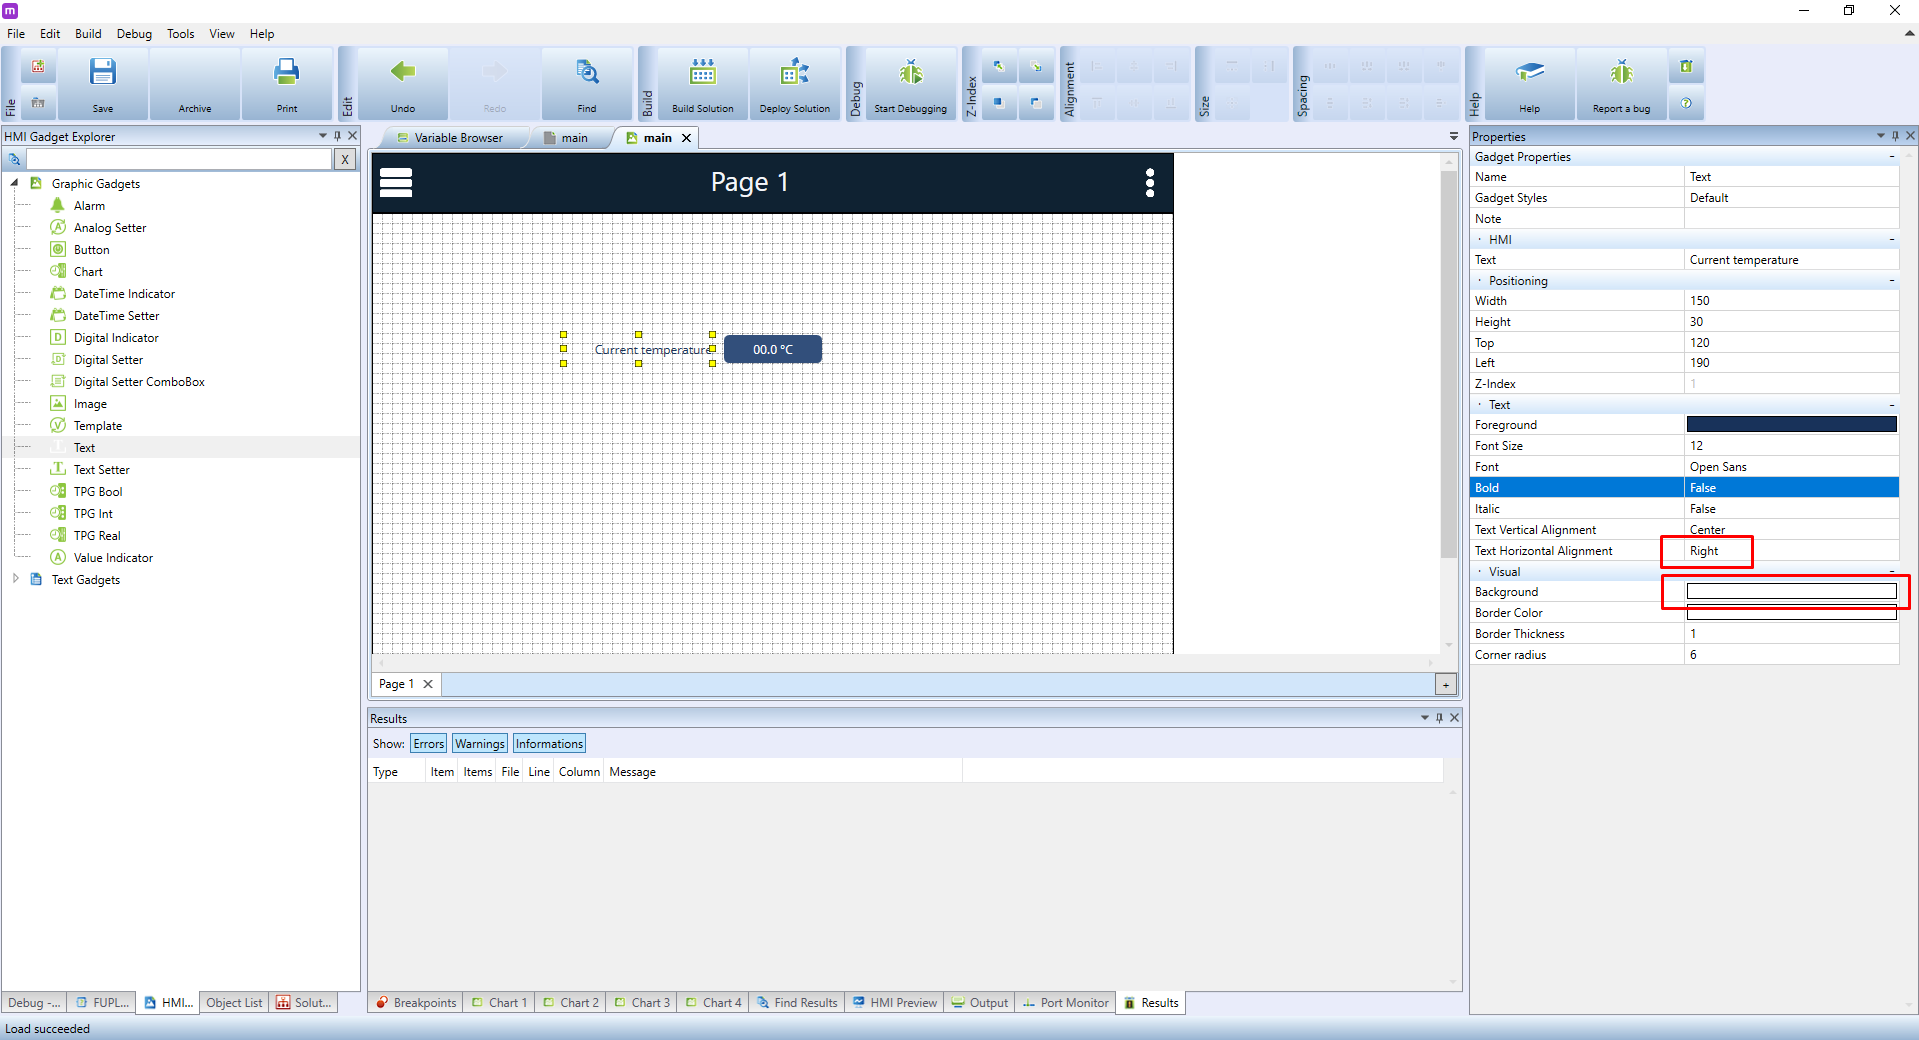
Now change the Background colour to white, and Text Horizontal Alignment to Right.
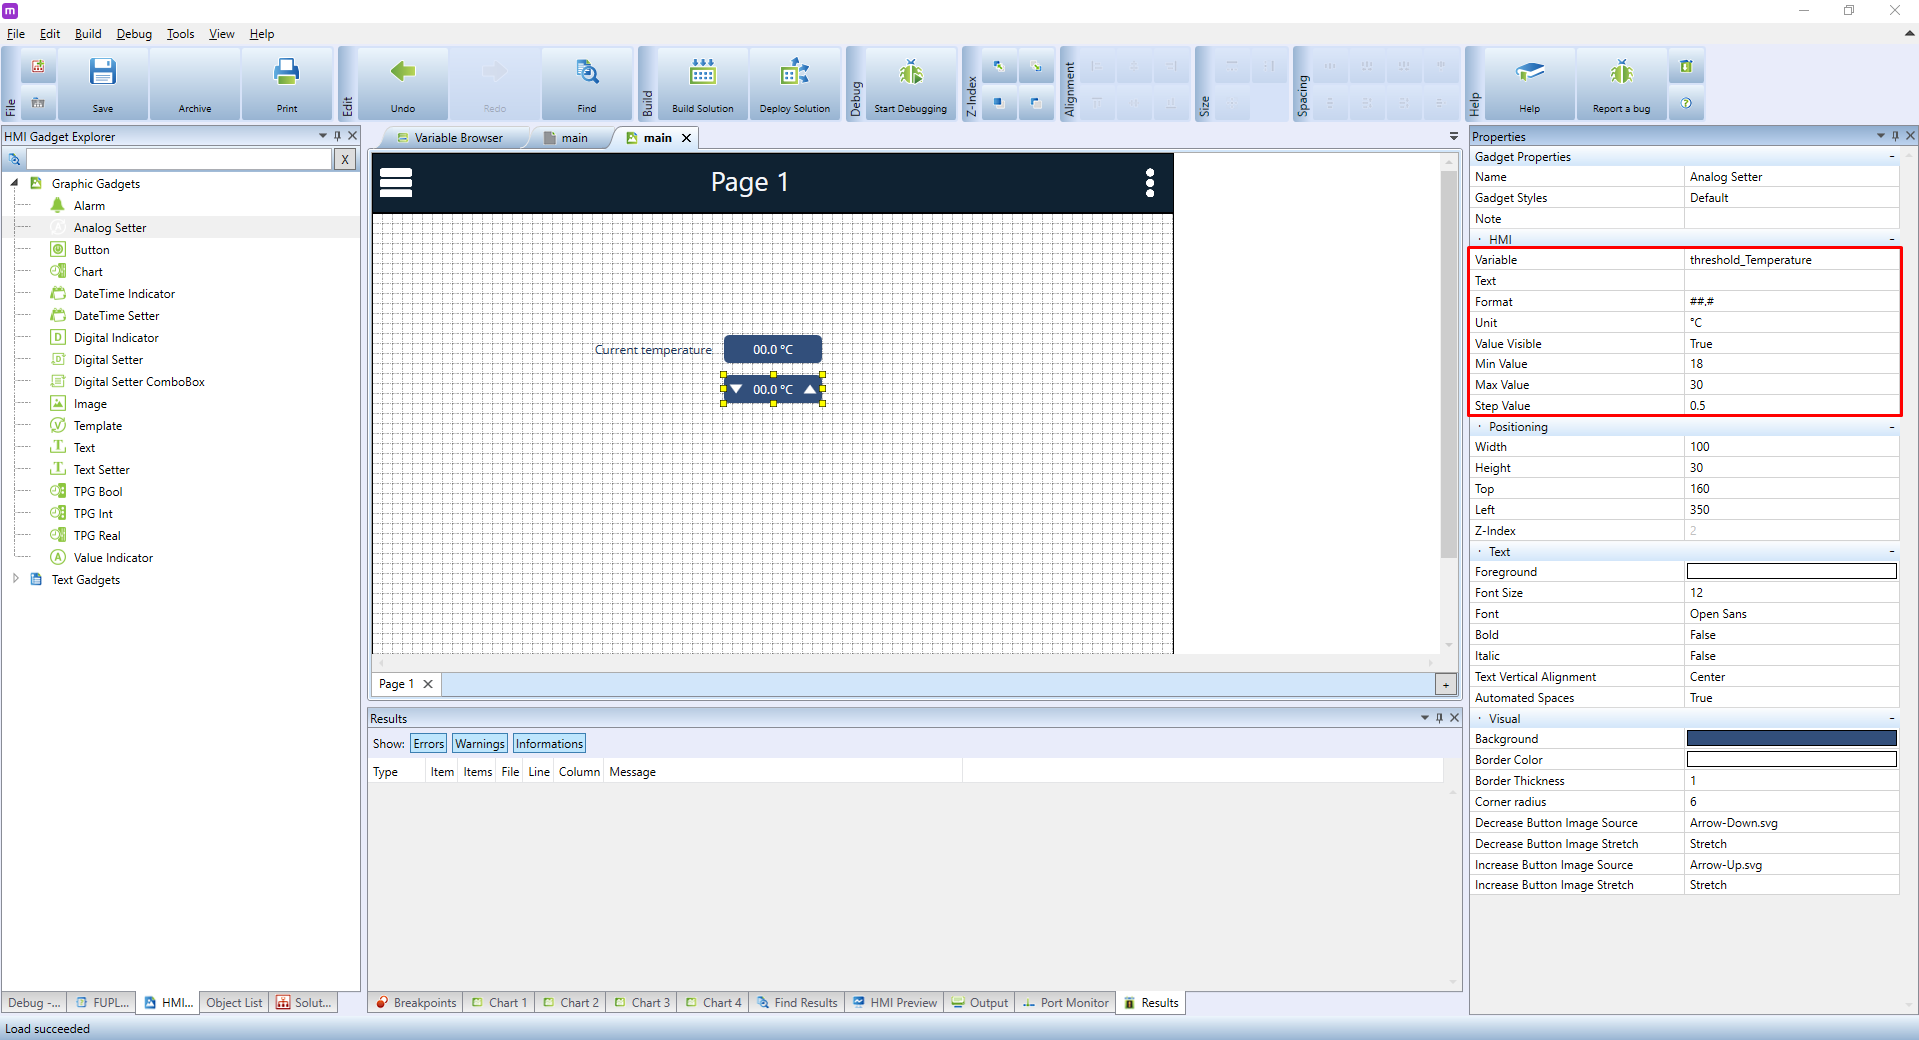
The next step is to add an element that would allow us to display and configure the values of an analogue variable. Theoretically, we could again use the Value Indicator. However, this element can only display values, not change them. A more suitable choice is the Analog Setter. Select it and place it onto the canvas. In the HMI properties, configure it as follows:
- Variable: choose a suitable variable representing temperature. In our case, we will select threshold_temperature variable
- Unit should be set to °C as the variable is expressed in degrees Celsius.
- Min Value will be 18, which will prevent users to set a temperature lower than 18 °C
- Max Value is 30 to prevent users to set a temperature higher than 30 °C
- Step Value, or the increment by which the temperature can be adjusted. Set it to 0.5
We will also create a text label for the element in the same way as with Current temperature. You can simply copy and paste the text fields and edit the text afterwards.
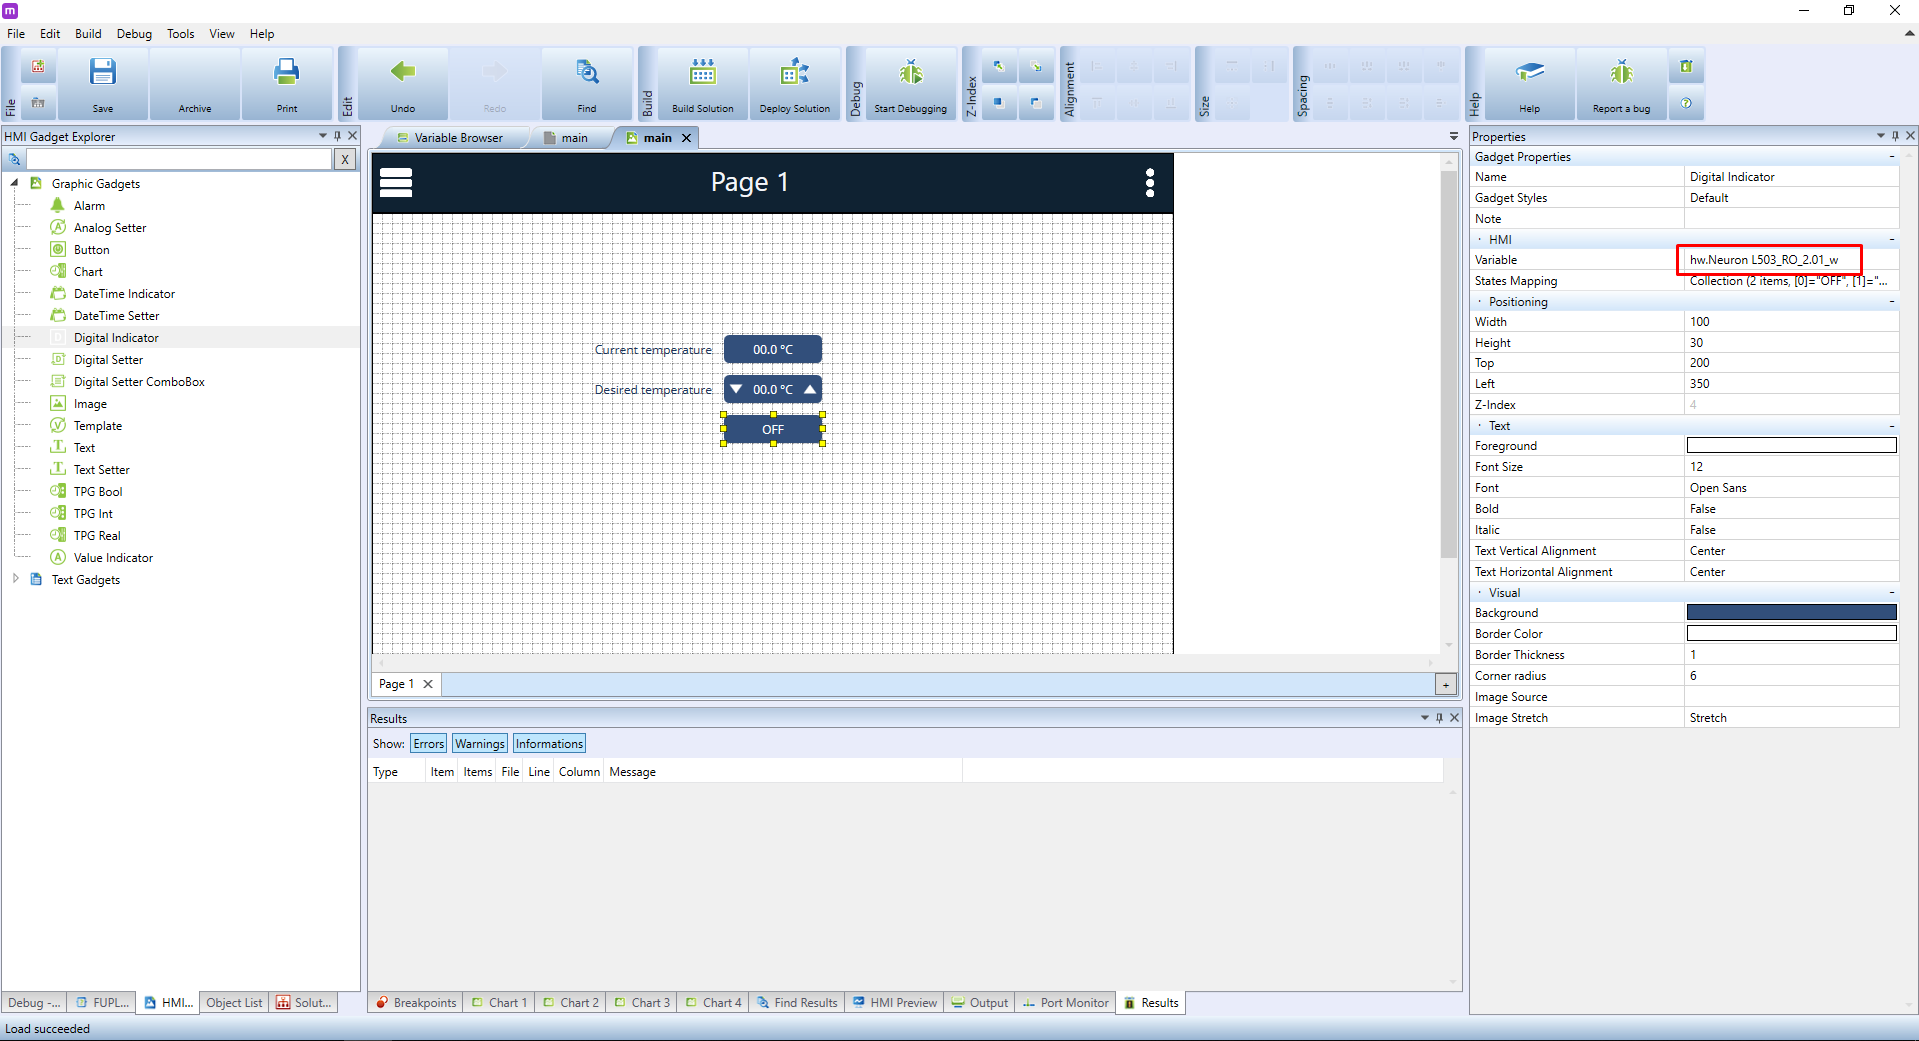
The last element we will need is an indication of heating status, eg. if the heating is ON or OFF. Again, we could simply use the Value Indicator, but we won't since this element can display only binary values (0 or 1). A better choice is the Digital Indicator. Select it and place it onto the canvas. Here, you need only to select the correct variable, ie. DI_1.02.
We recommend giving inputs/outputs descriptive names such as light_kitchen, door_bell etc. There are two main reasons:
- Such names will make the project much clearer and easier to read
- If you decide to plug a sensor to a different input, all you need to do is to rename the input variable with the rest of the program still using the same name
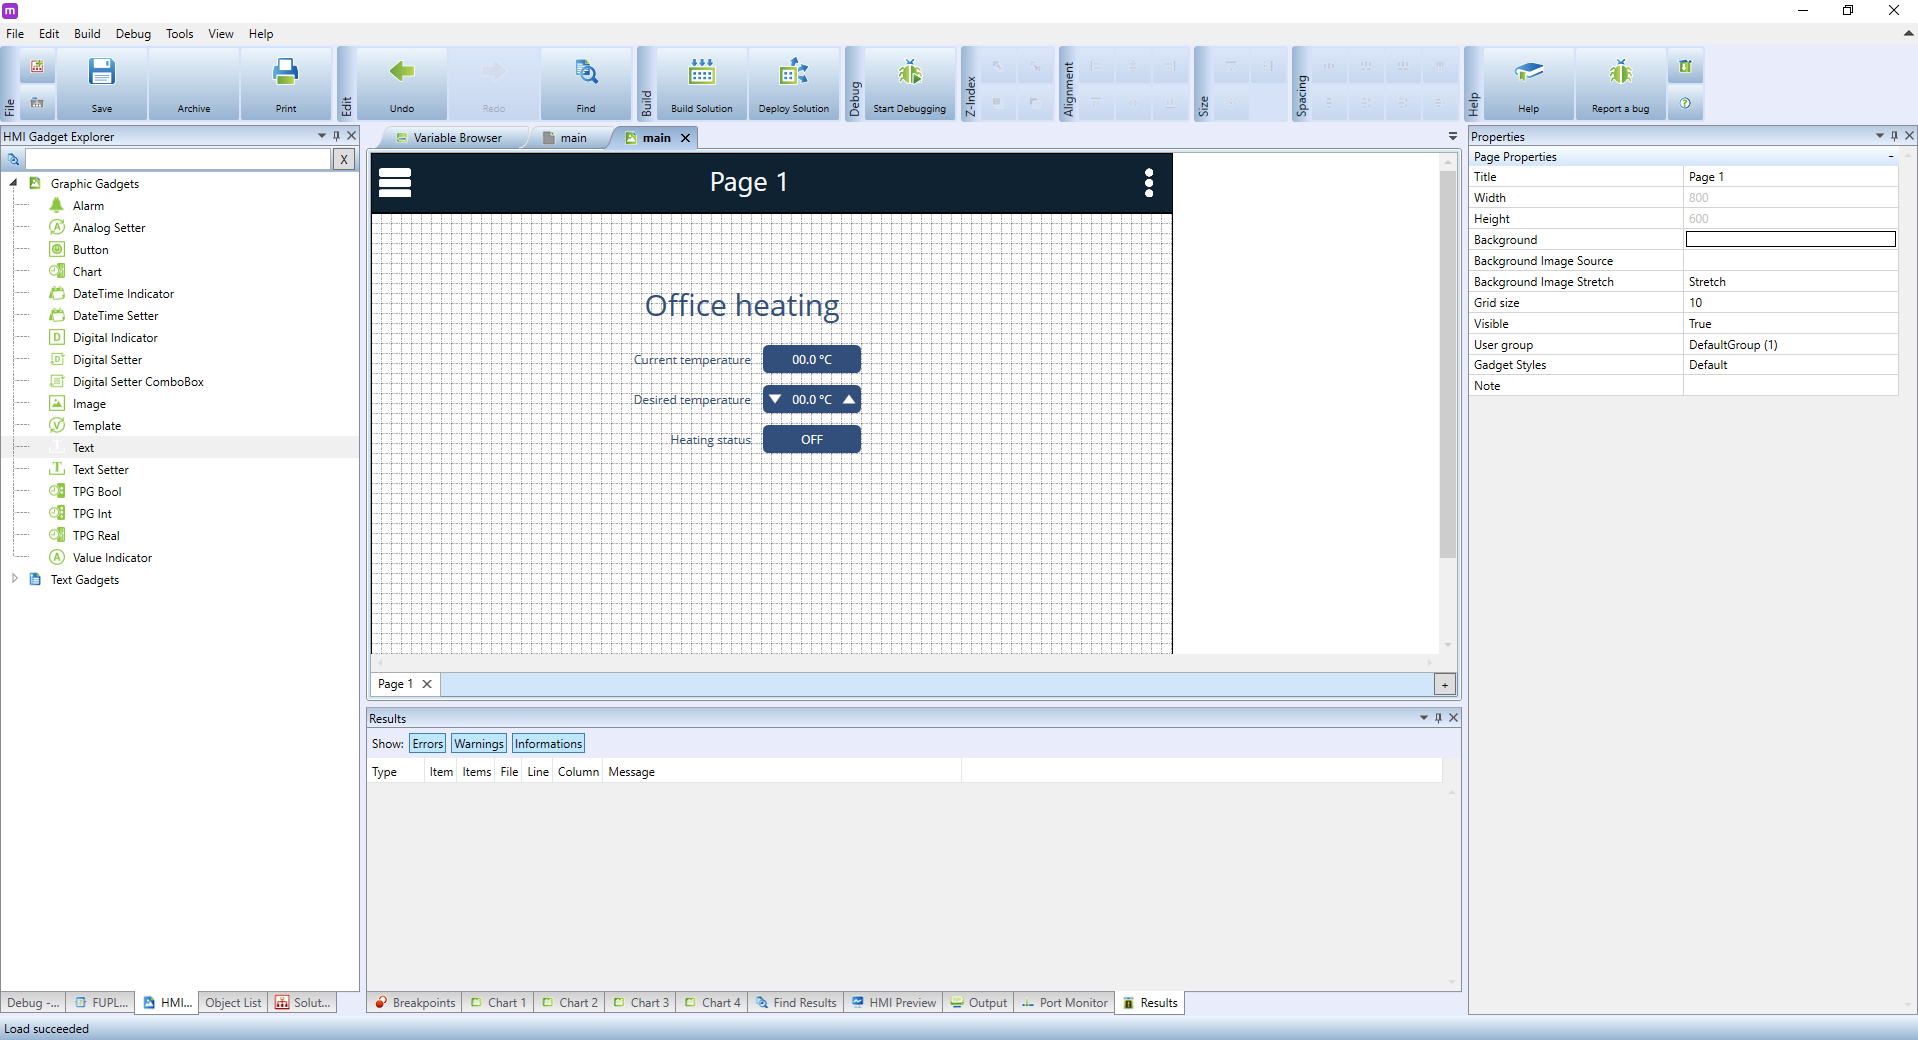
At this point, only a couple of finishing touches is needed. Give the heating status indicator a name and then create another, a larger text field for the name of the entire HMI project. The result can look like this:
Uploading Mervis SCADA project definition
With all things in place, click on Build Solution. In the build dialogue, make sure to check the SCADA box next to the terminal. By building the solution an export subfolder will be created in the folder containing all project files. Another subfolder will be then created in the export subfolder containing a ZIP archive with a SCADA project definition. This archive is the last important component needed to get the Mervis SCADA running.
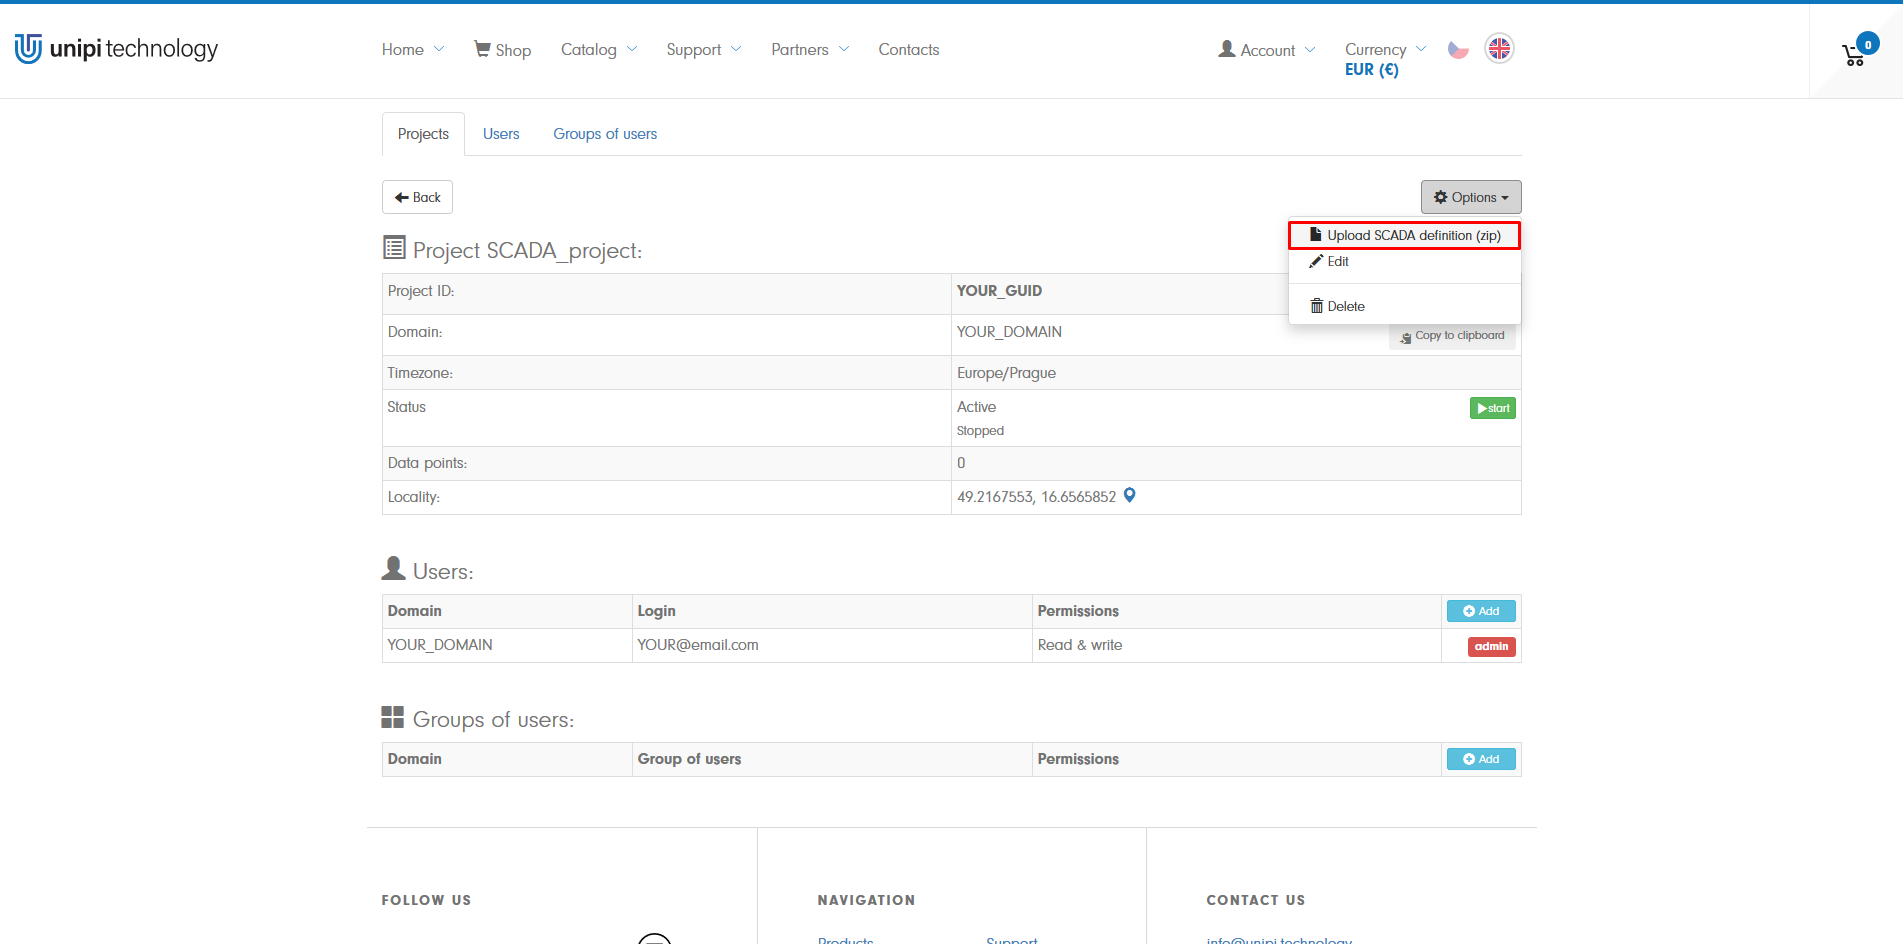
In the Unipi customer portal, open the project created in the first chapter. The Options tab in the upper right corner is used, among others, to upload SCADA terminal definitions into Mervis SCADA projects. The SCADA definition is represented by the above-mentioned SCADA project archive, all you need to do is to click on Upload SCADA definition:
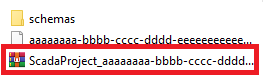
Here, select the right archive from the export folder placed in the project's folder.
In case the SCADA graphic scheme will not display:
- Make sure the template is assigned in the SCADA terminal properties.
- Did you compile/deploy the solution prior to uploading the definition in your customer account?
- Log off the SCADA interface and log in back again.
You can now return back to the main Mervis SCADA tutorial.
Remove duplicate data points
If the number of data points increases after you add a graphic scheme to SCADA, even if you use the same data points, it is due to their different settings in the data point table and in the scheme. In this chapter, you'll learn how to get as few duplicate data points as possible.
The digital or analog inputs and outputs described below are not the inputs and outputs of the unit, but the designation of the input and output values for Mervis SCADA. The digital input in SCADA only indicates the status, while the output can be set.
When setting, pay attention to invisible characters, which can also cause a difference between the diagram and the table.
Available from Mervis IDE version 2.4.2!
Digital inputs/outputs
For digital values, the solution is very simple, you only need to set the same states mapping for identical data points in the table and in the graphic scheme.
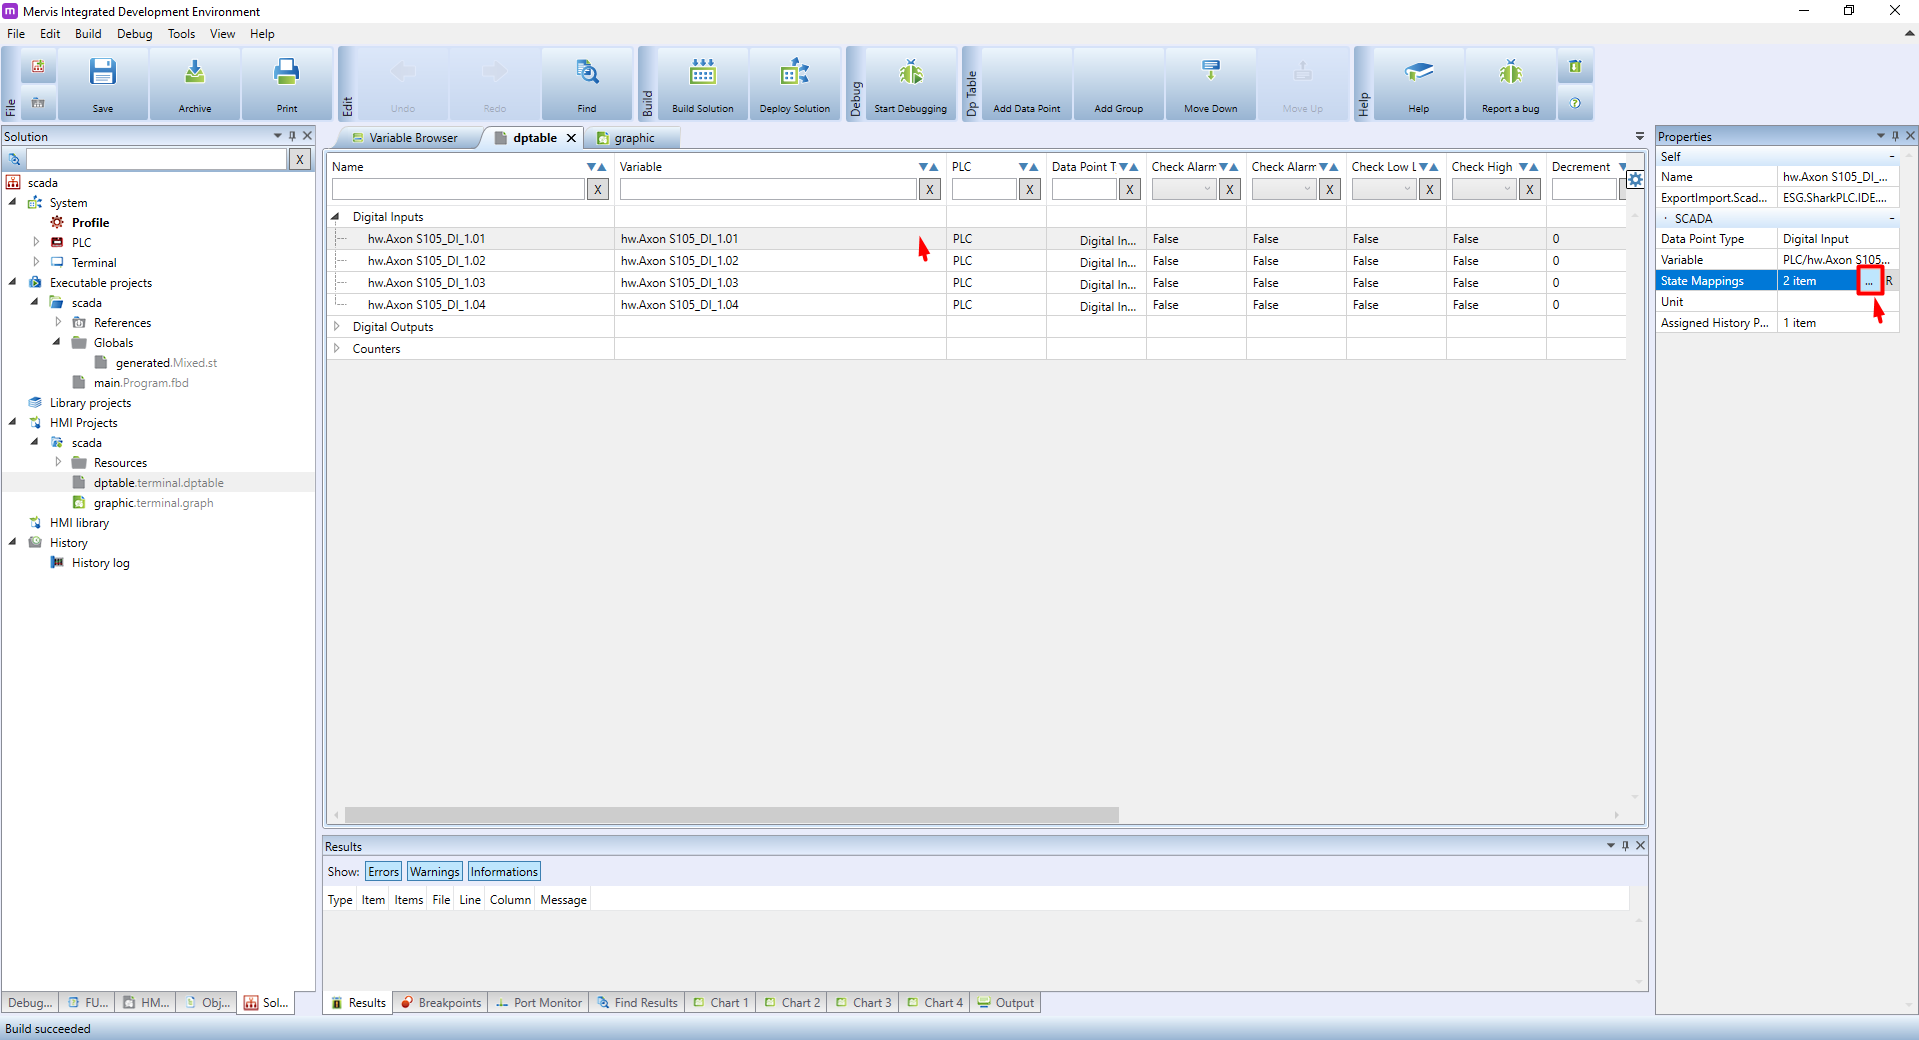
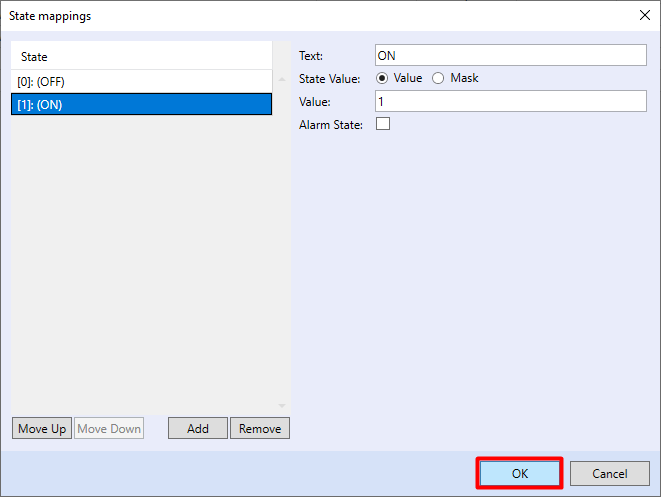
First, open the data point table in the Mervis IDE and click on the row with the required digital data point. Its properties are displayed in the right panel, select State mappings here and click on the three-dot symbol .
Set the required states and their name according to the data type. In this case, we set two states ON and OFF, as it is a two-state variable of type BOOL. After setting, confirm by clicking OK.
Now open the graphic scheme for Mervis SCADA and find the element bound to the same variable that you set in the previous step. Click on this element to display its properties in the right panel, select States mapping, and click on the symbol with three dots .
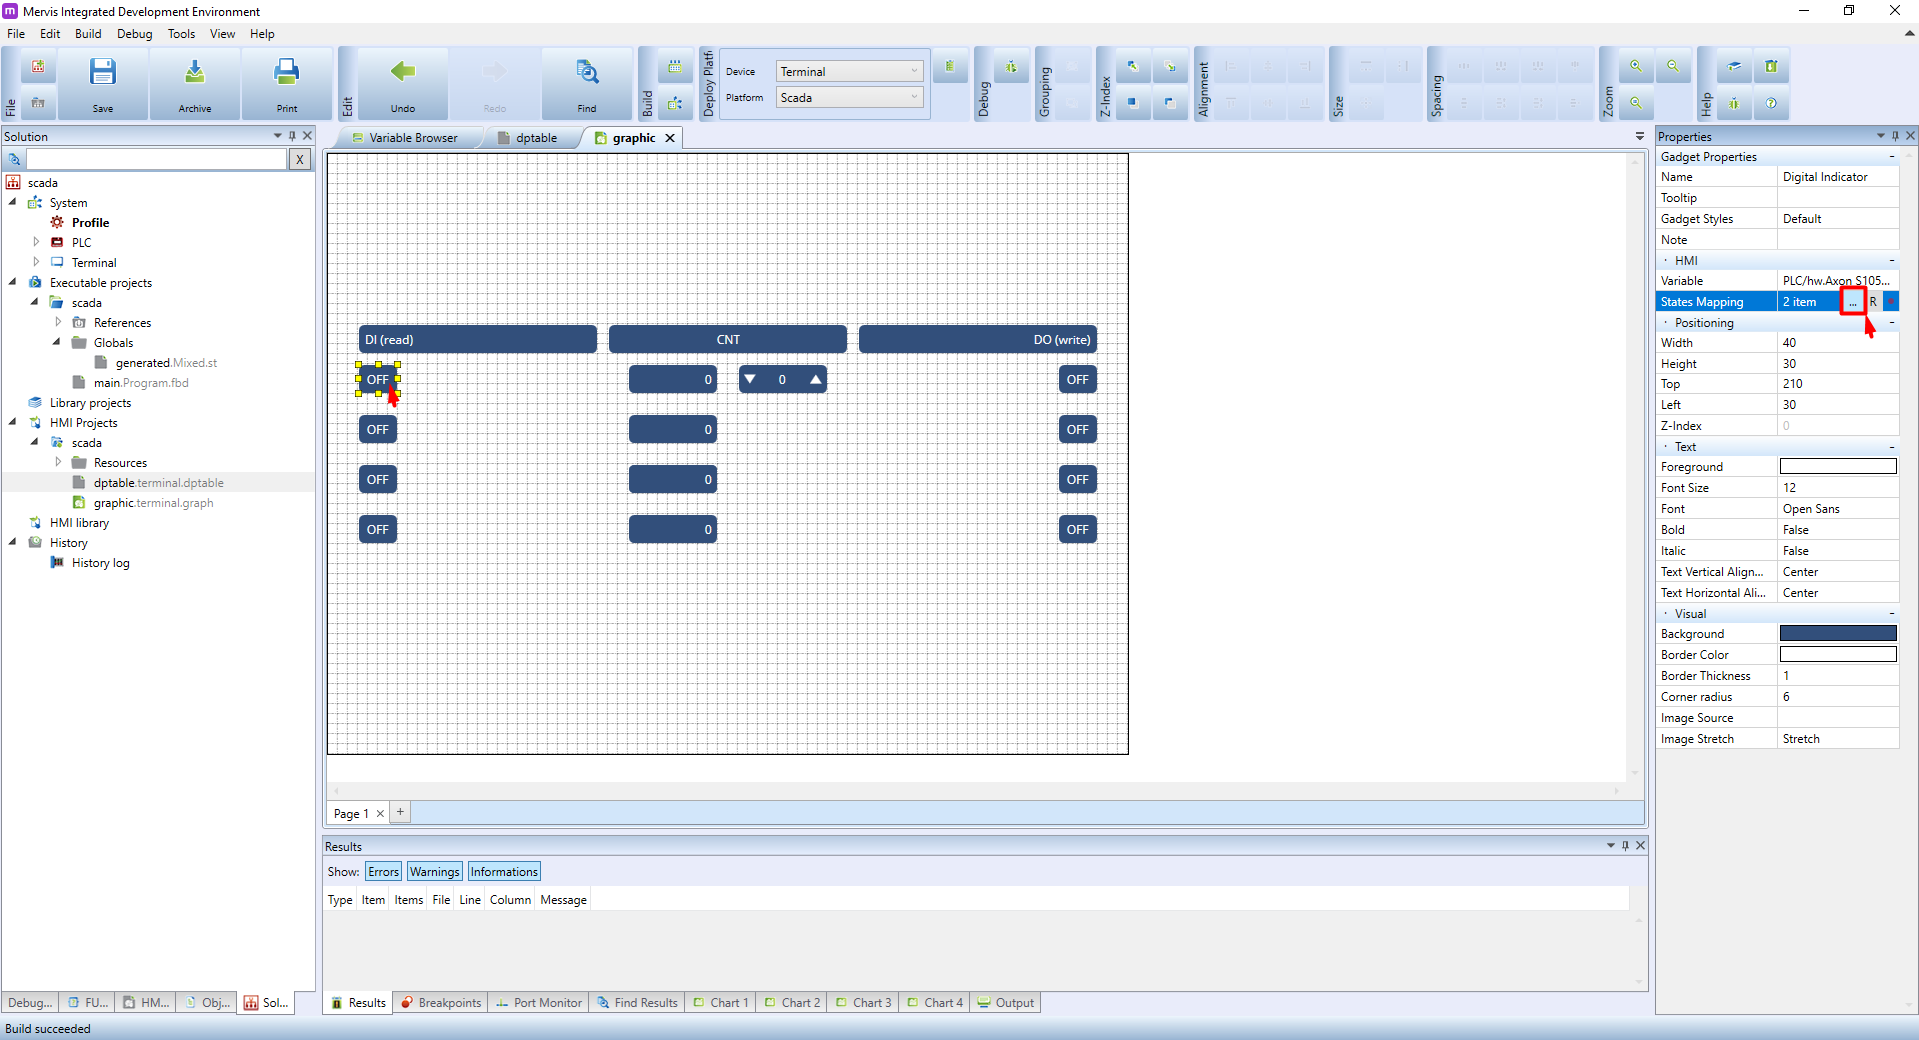
Set the states mapping to match the previous setting for the data point in the table, i.e. ON and OFF.
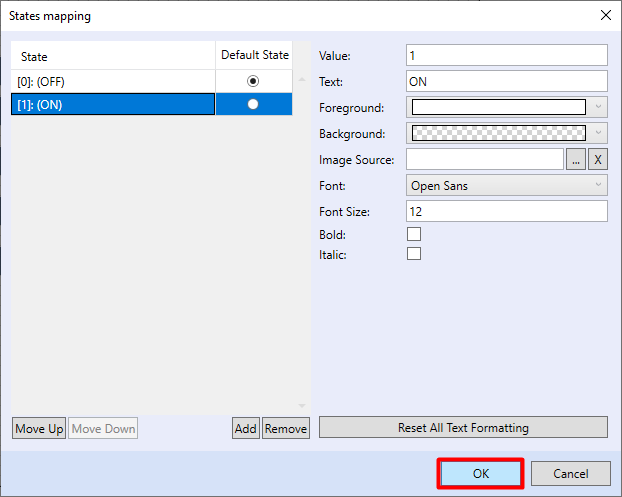
With this setting, when the states are identical, text states are displayed for the graphic element in the diagram. If you want the text not to be visible (e.g. because you want to replace the states ON and OFF with an image - light, pump, etc.), this can be achieved by setting the foreground colour to “transparent ”.

Images can be set arbitrarily since they do not create duplicates.
Analog inputs
For analog inputs, the setting is more complicated and it is necessary to set more parameters. Again, however, they must be the same for the same data points in the table and in the graphic scheme.
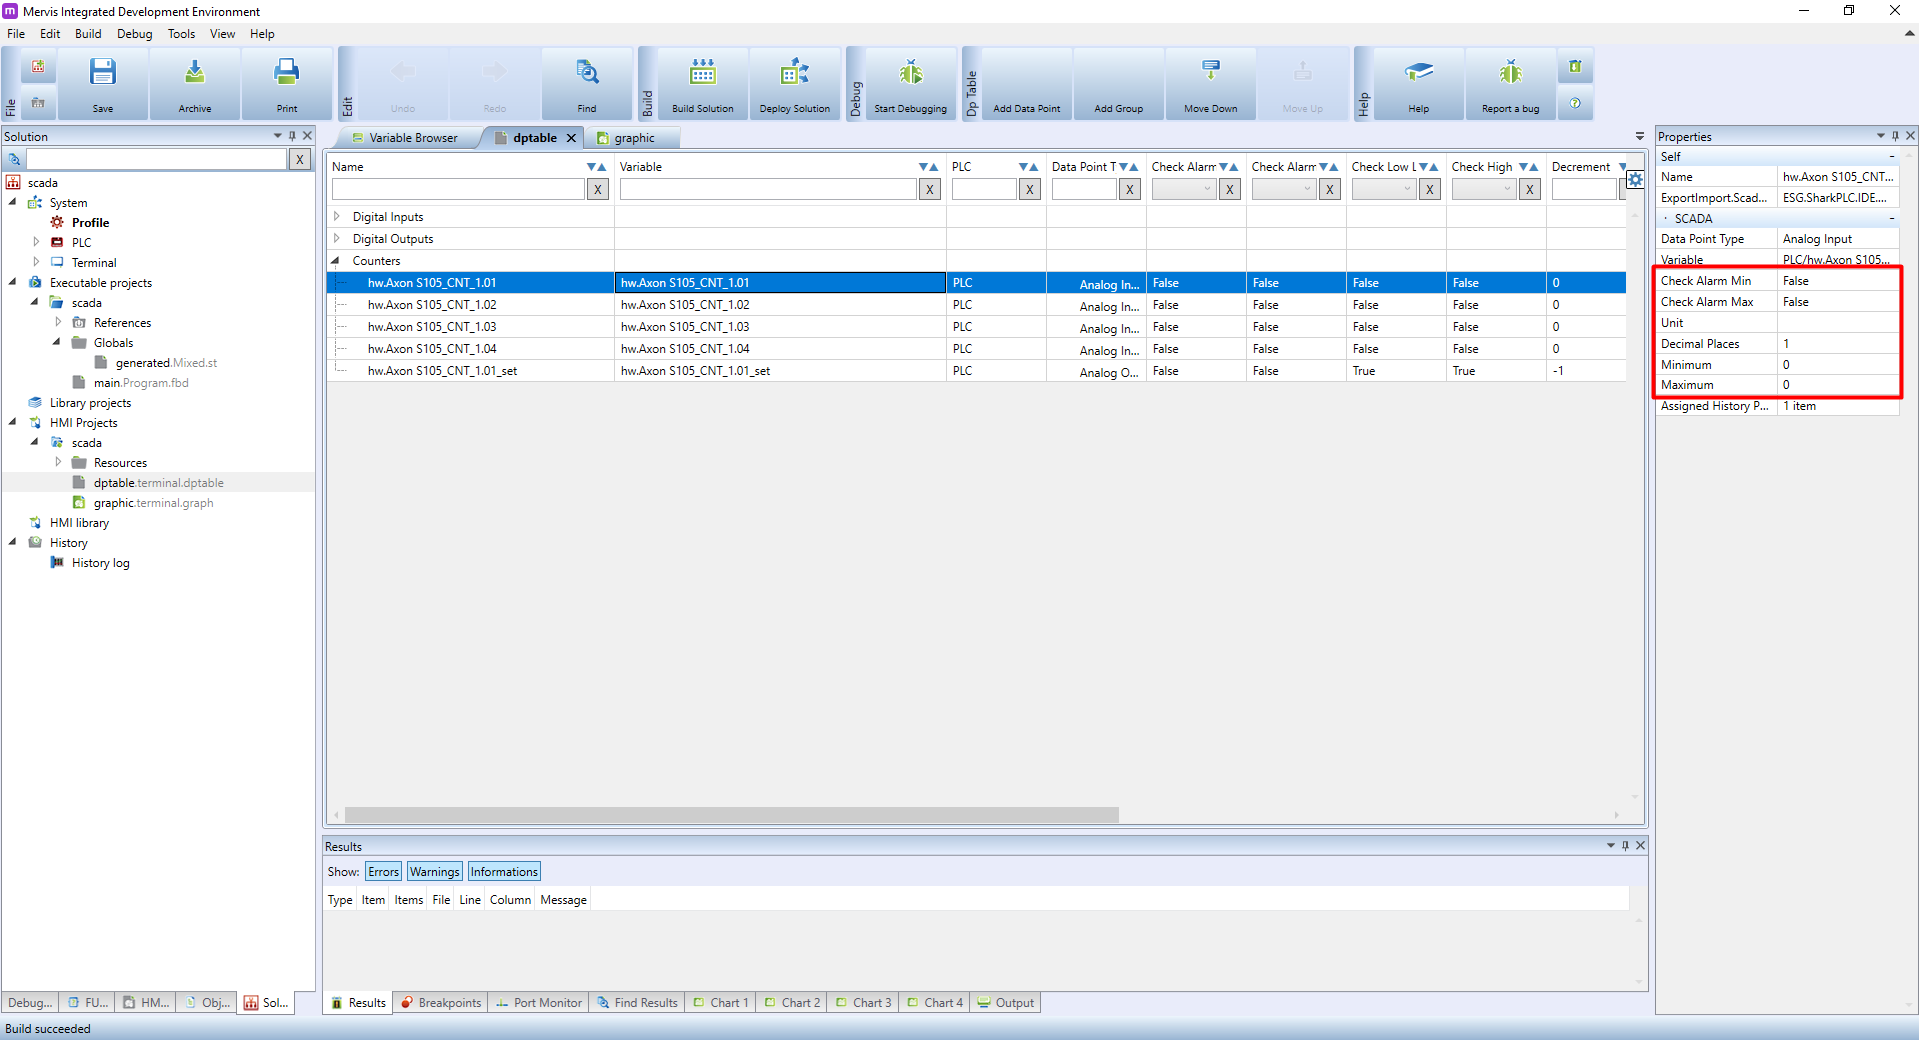
First, open the data point table in the Mervis IDE and click on the row with the required analog input. The right panel shows its properties, here are the important parameters:
- Check Alarm Min - “False” must be turned off
- Check Alarm Max - “False” must be turned off
- Unit - must be identical (watch out for invisible characters)
- Decimal places - must be the same (integer)
- Minimum - must be 0
- Maximum - must be 0
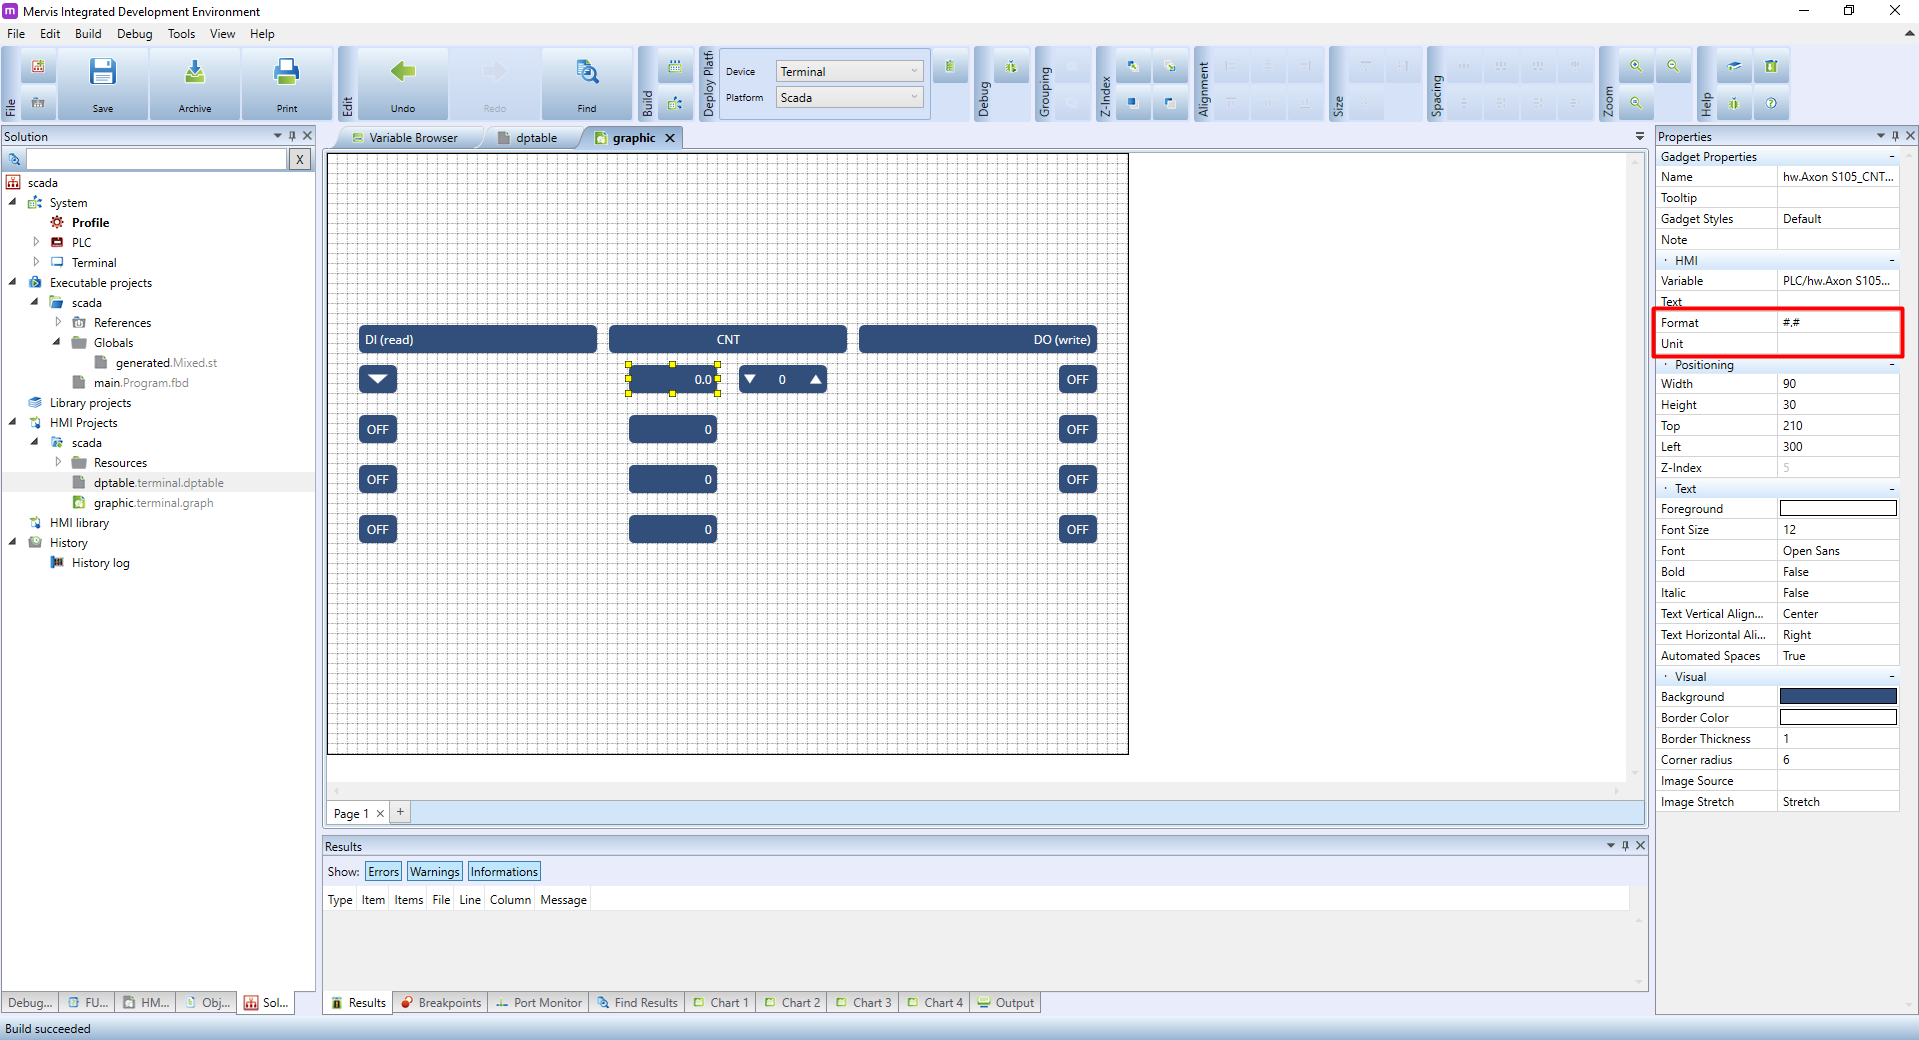
Now open the graphic scheme for Mervis SCADA and look for the “Value indicator” element bound to the same variable you set in the previous step. Click on this element to display its properties in the right panel, here are the important parameters:
- Format - number of crosses # after the dot indicates the number of decimal places
- Unit - must be the same as the unit in the previous step
Analog outputs
You will find even more parameters that need to be set for analog outputs. Here, too, they must be identical for identical data points in the table and in the graphic scheme.
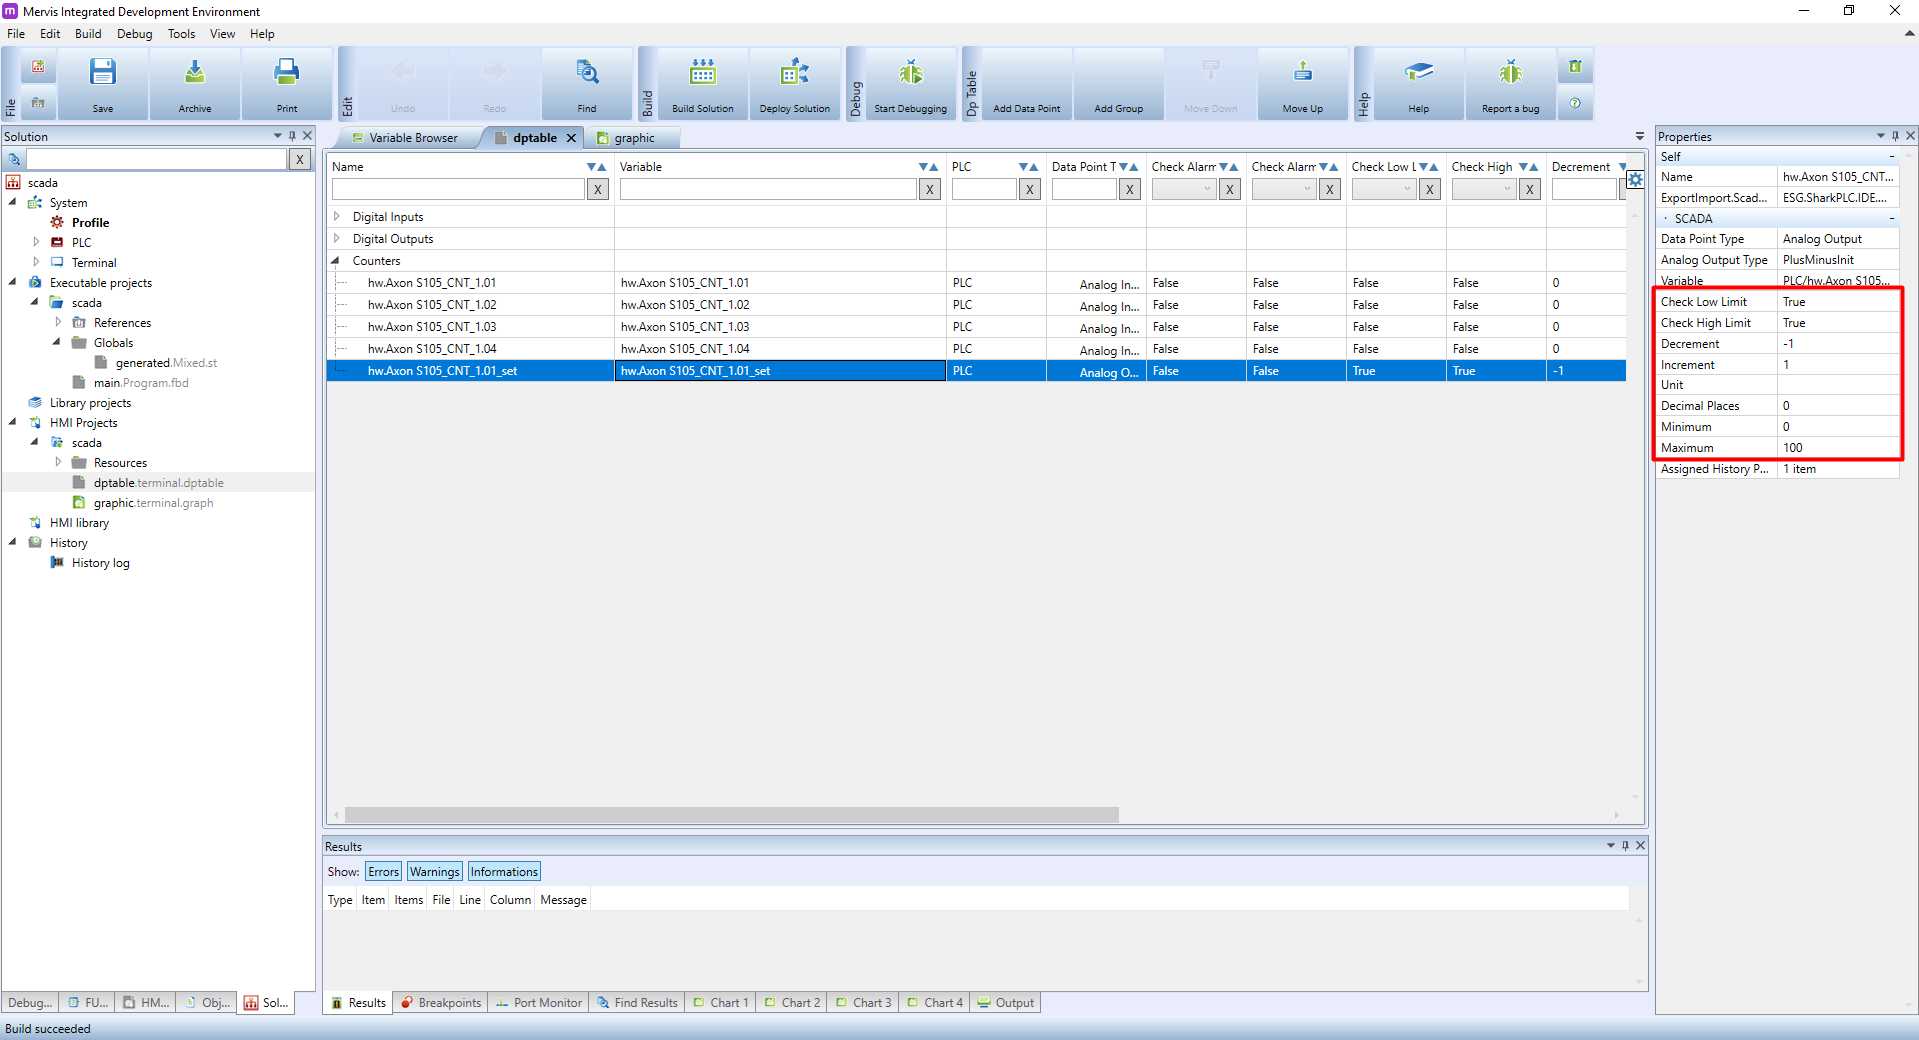
First, open the data point table in the Mervis IDE and click on the row with the required analog input. The right panel shows its properties, here are the important parameters:
- Check Low Limit - “True” must be turned on
- Check High Limit - “True” must be turned on
- Decrement - used to set the stepping using the buttons, the value must be the same as the increment, only negative
- Increment - the value must be the same as the decrement, only positive
- Unit - must be identical (watch out for invisible characters)
- Decimal Places - must be the same (integer)
- Minimum - can be set, but must be the same
- Maximum - can be set, but must be the same
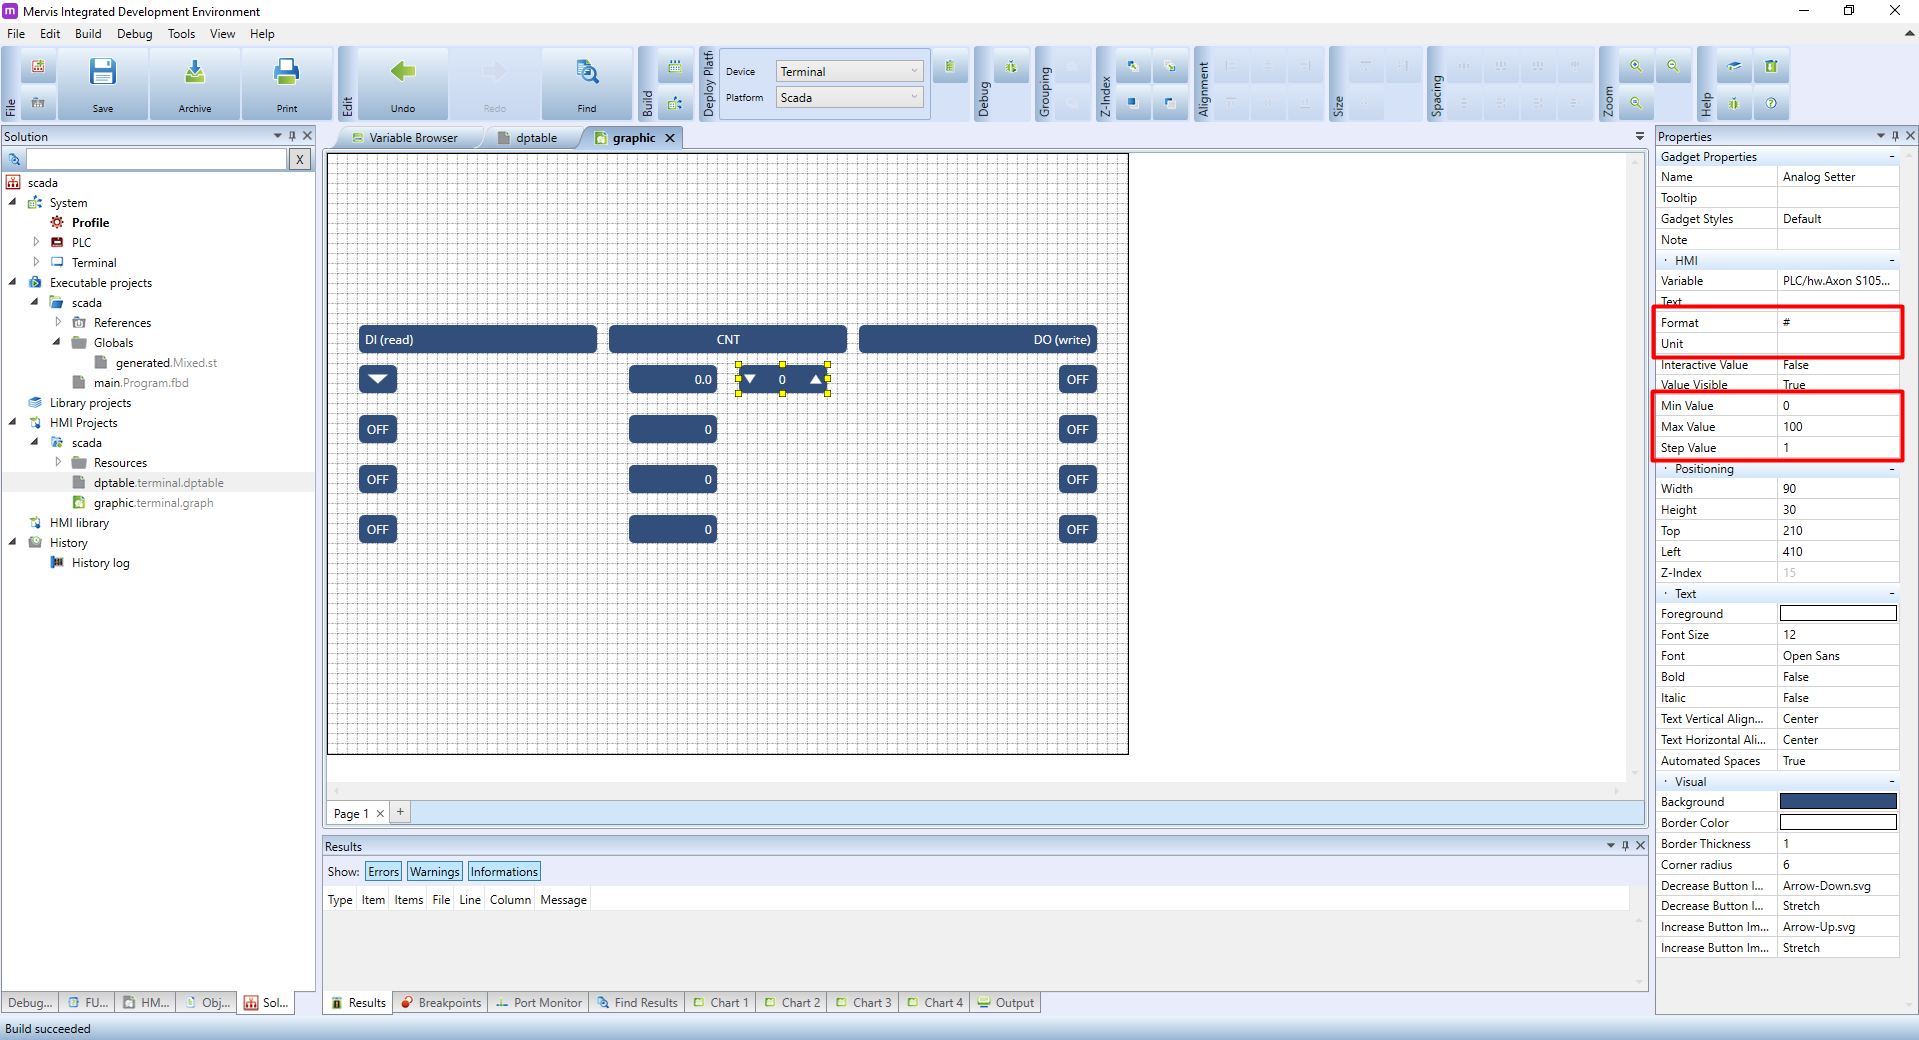
Now open the graphic scheme for Mervis SCADA and find the “Analog Setter” element bound to the same variable you set in the previous step. Click on this element to display its properties in the right panel, here are the important parameters:
- Format - number of crosses # after the dot indicates the number of decimal places
- Unit - must be the same as the unit in the previous step
- Min. value - must be the same as the minimum in the last step
- Max. value - must be the same as the maximum in the previous step
- Step value - must be identical to the increment (decrement) from the previous step
Now you have all the necessary parameters set for these data points so that duplications do not occur.