Let's move to a description of Mervis IDE's individual components. We will refer to those parts frequently in other tutorials.
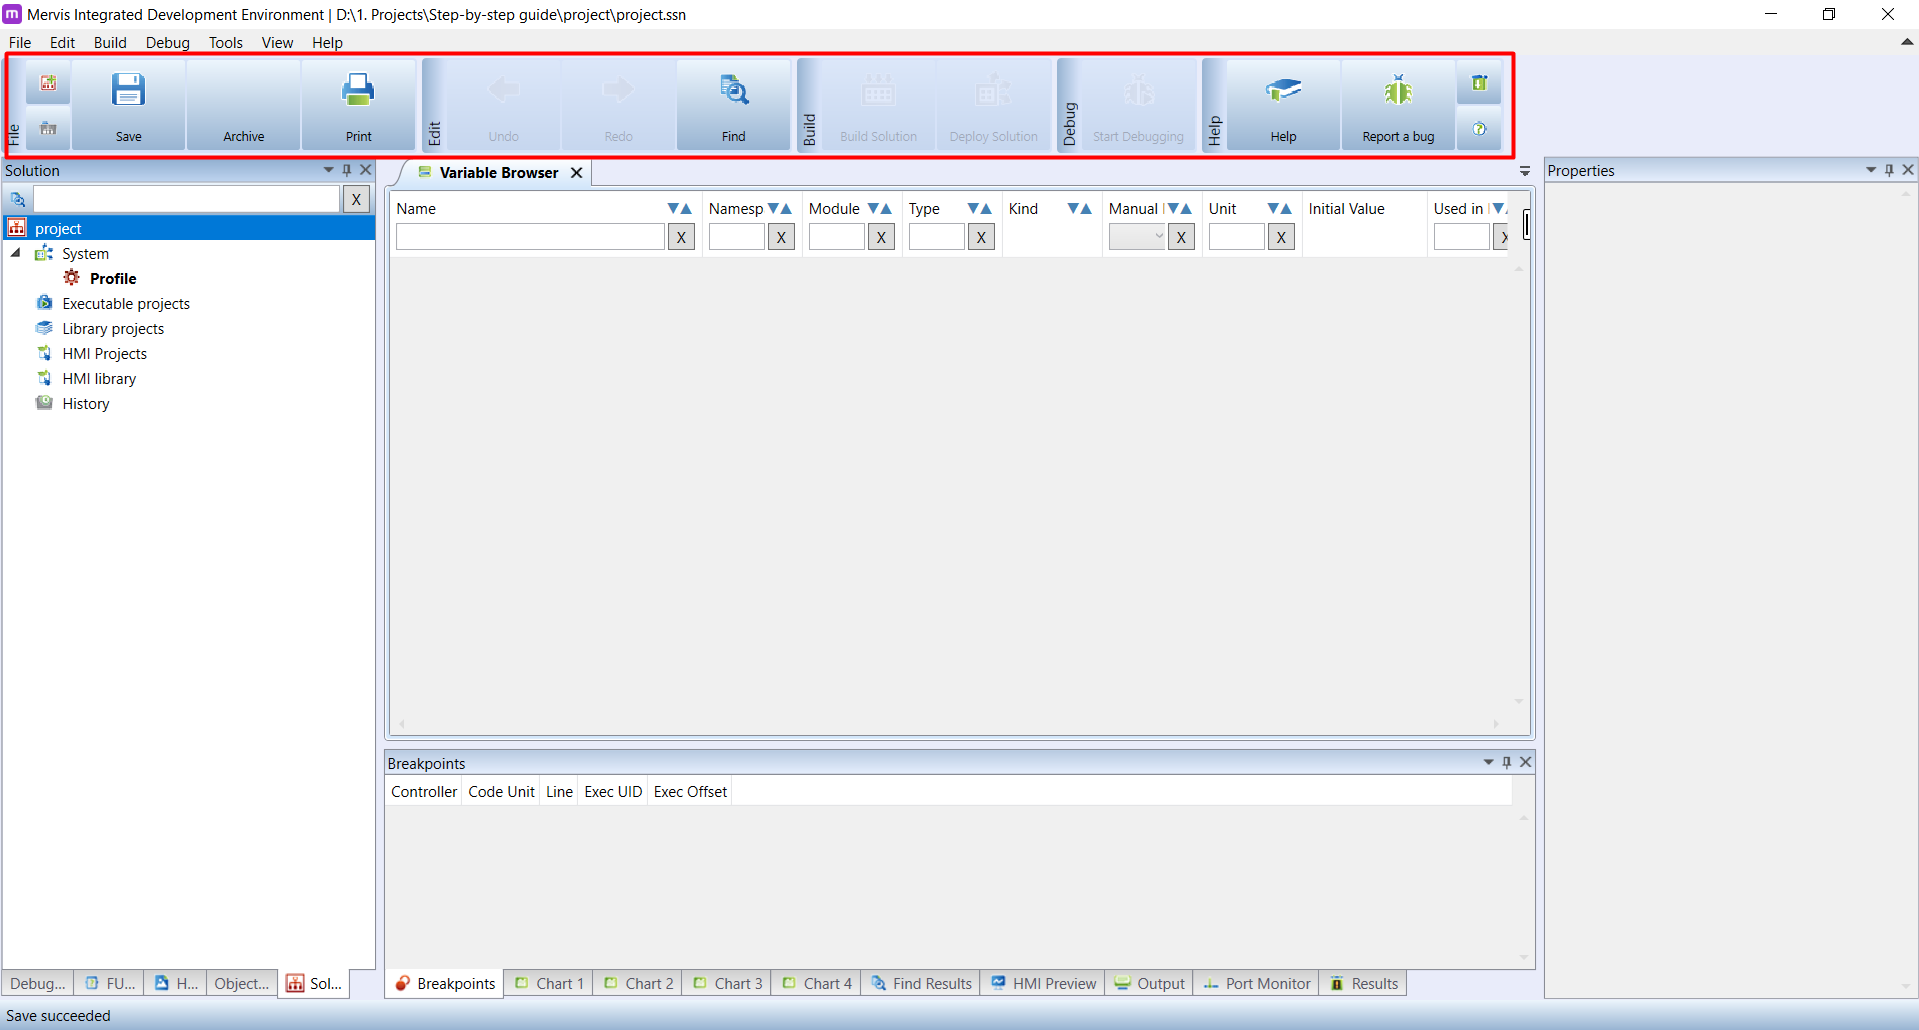
On the upper edge of the window, a list of icons is placed, called Ribbon. Icons change depending on the part of the IDE you are currently using.
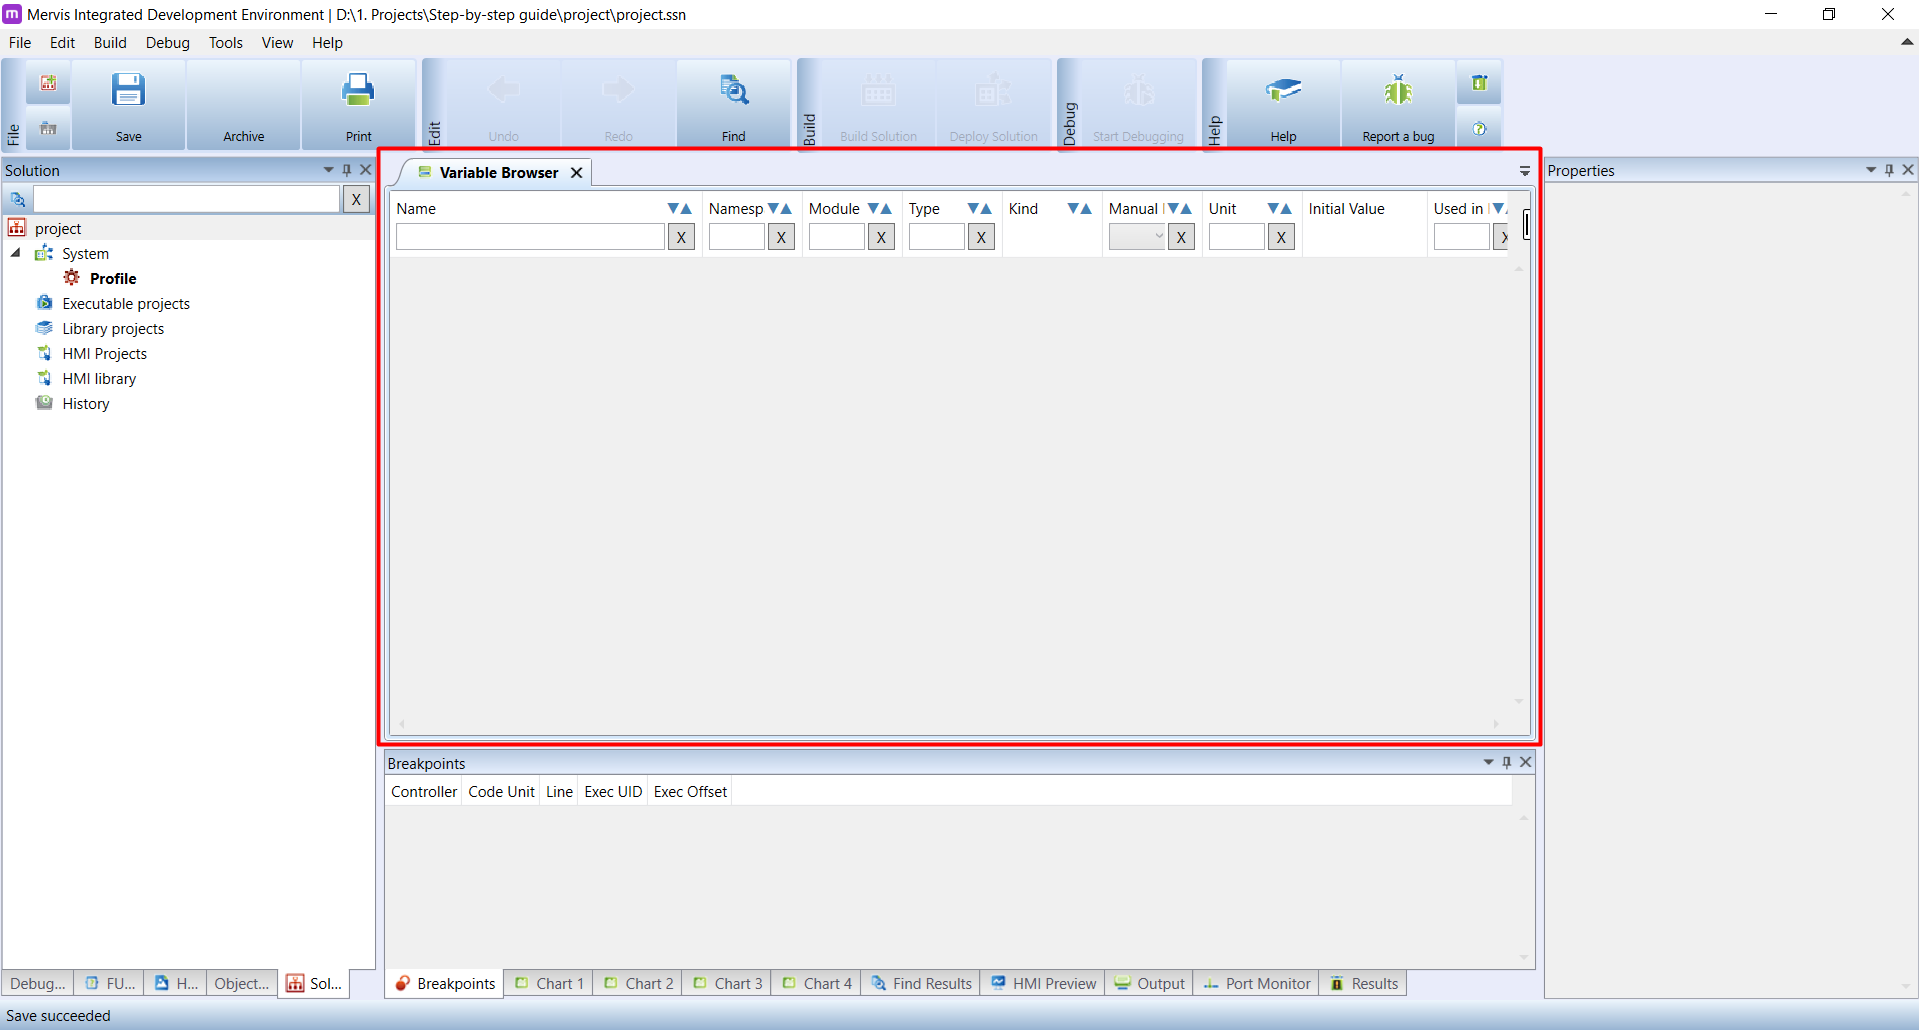
In the middle of the screen is a workspace called Main window, containing a number of sub-panels that are displayed as tabs on the main window's upper edge. That allows you to close any subpanel at any time and return to it simply by clicking its tab. Right now, the only visible tab is Variable Browser.
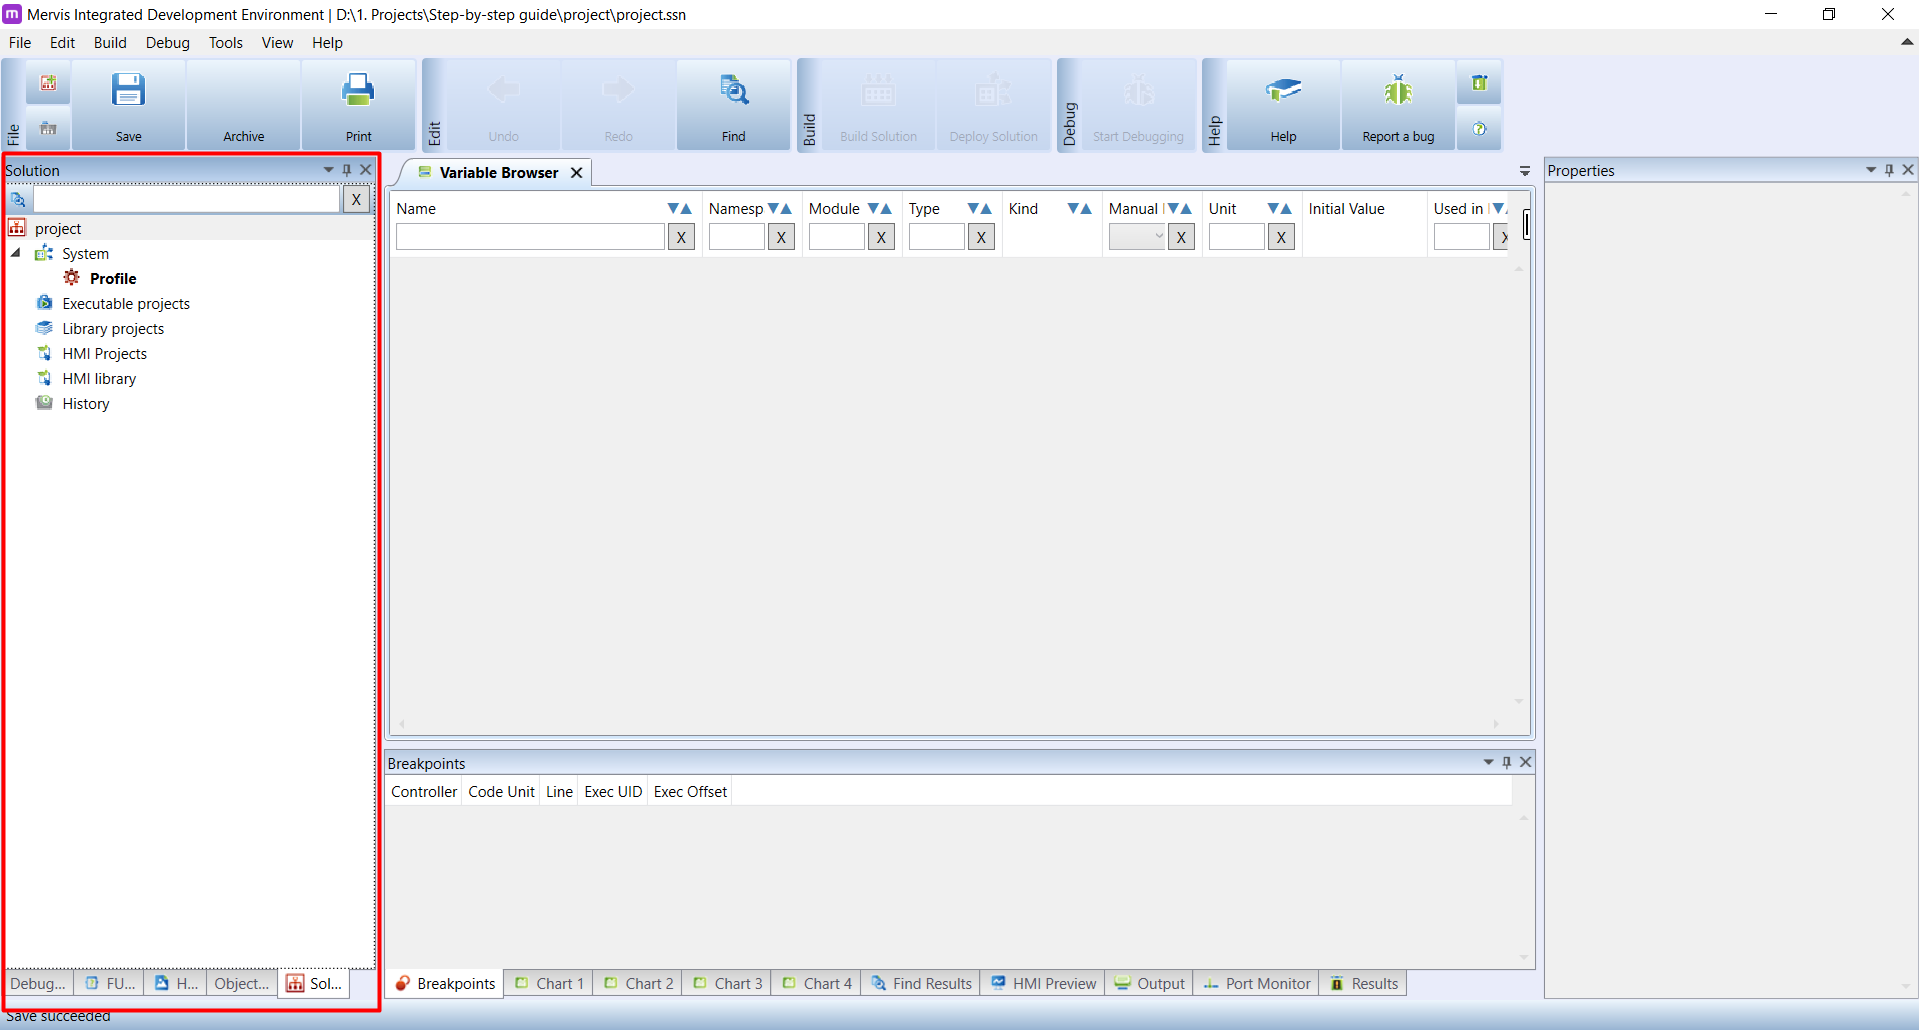
Left Panel is located at the screen's left edge. This panel also features a list of tabs - compared to the main window the tabs are placed at the bottom edge. This tabs cannot be removed and are named: Project, FUPLA Box Explorer, HMI Gadget Explorer, Object List and Debug - PrioQueue. Most of the time you will use Project tab visible here:
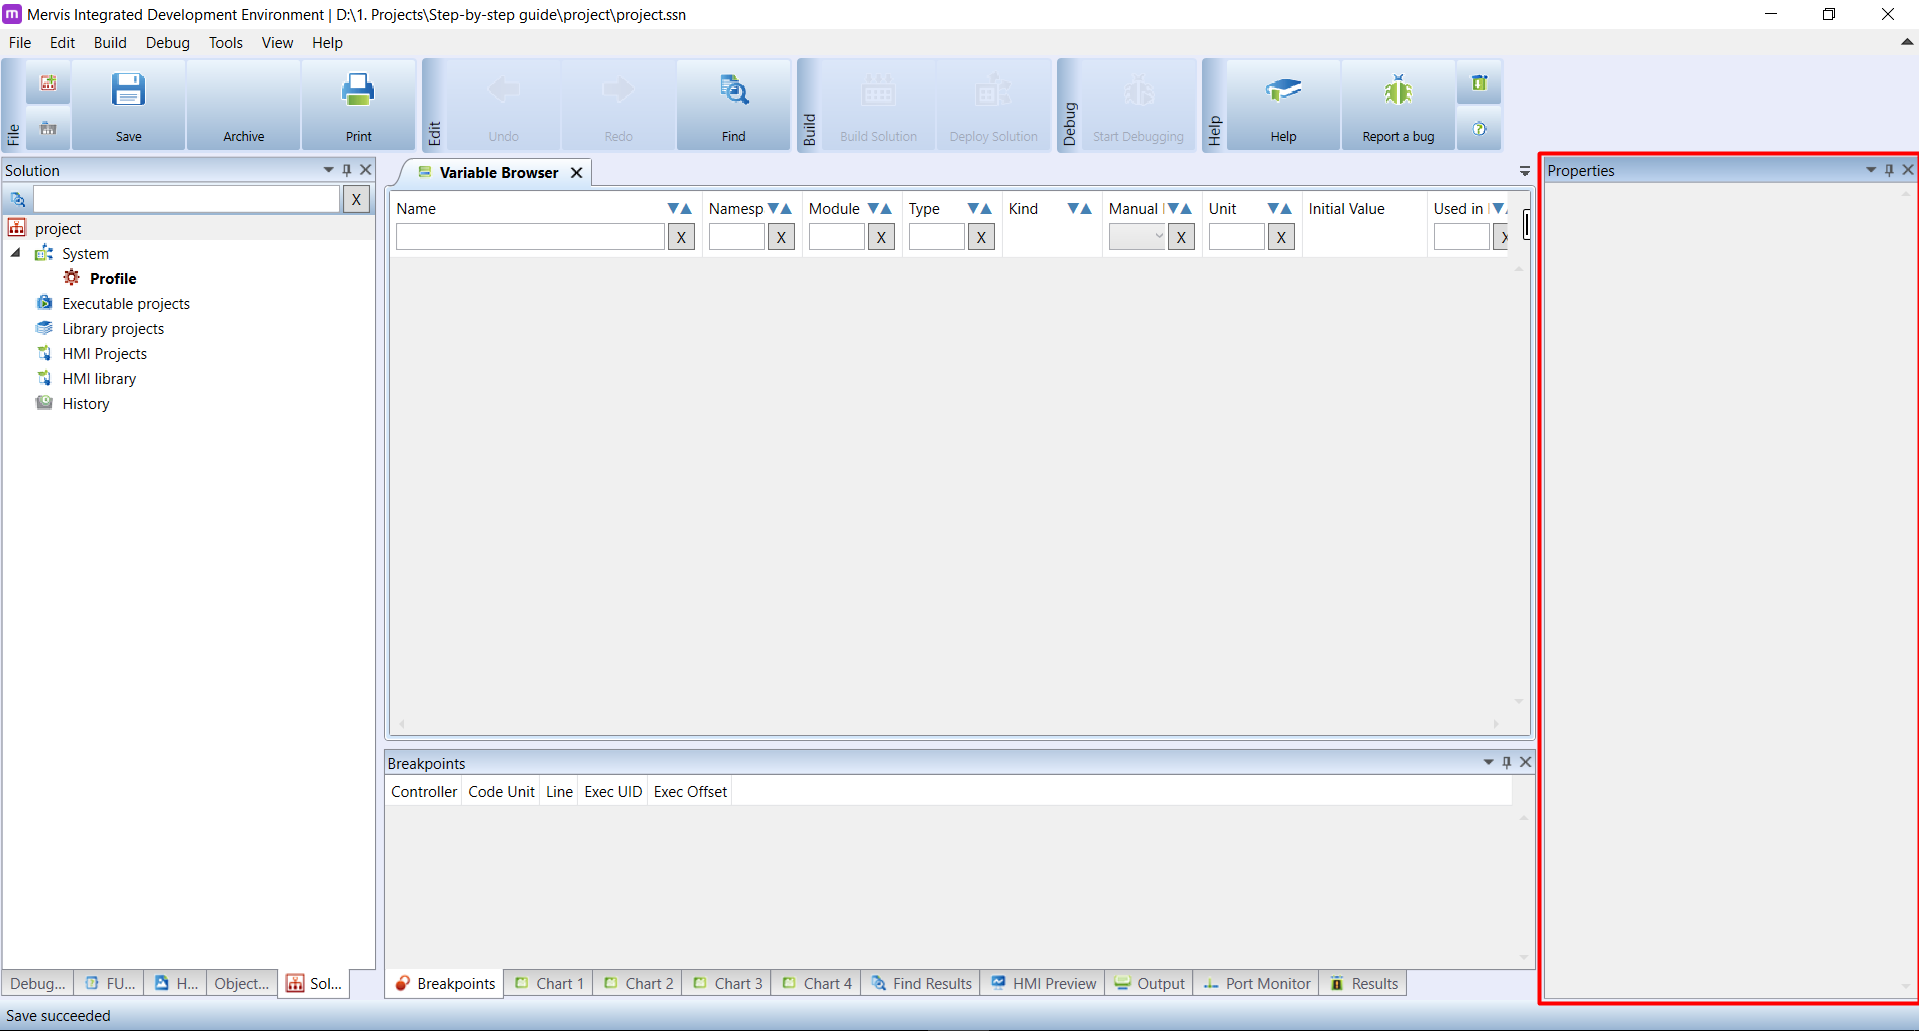
On the right side, you can see the Properties panel. This panel displays all available properties of the currently selected object, be it a unit, a channel, Modbus device, input/output or anything else. As nothing is selected right now the panel is empty.
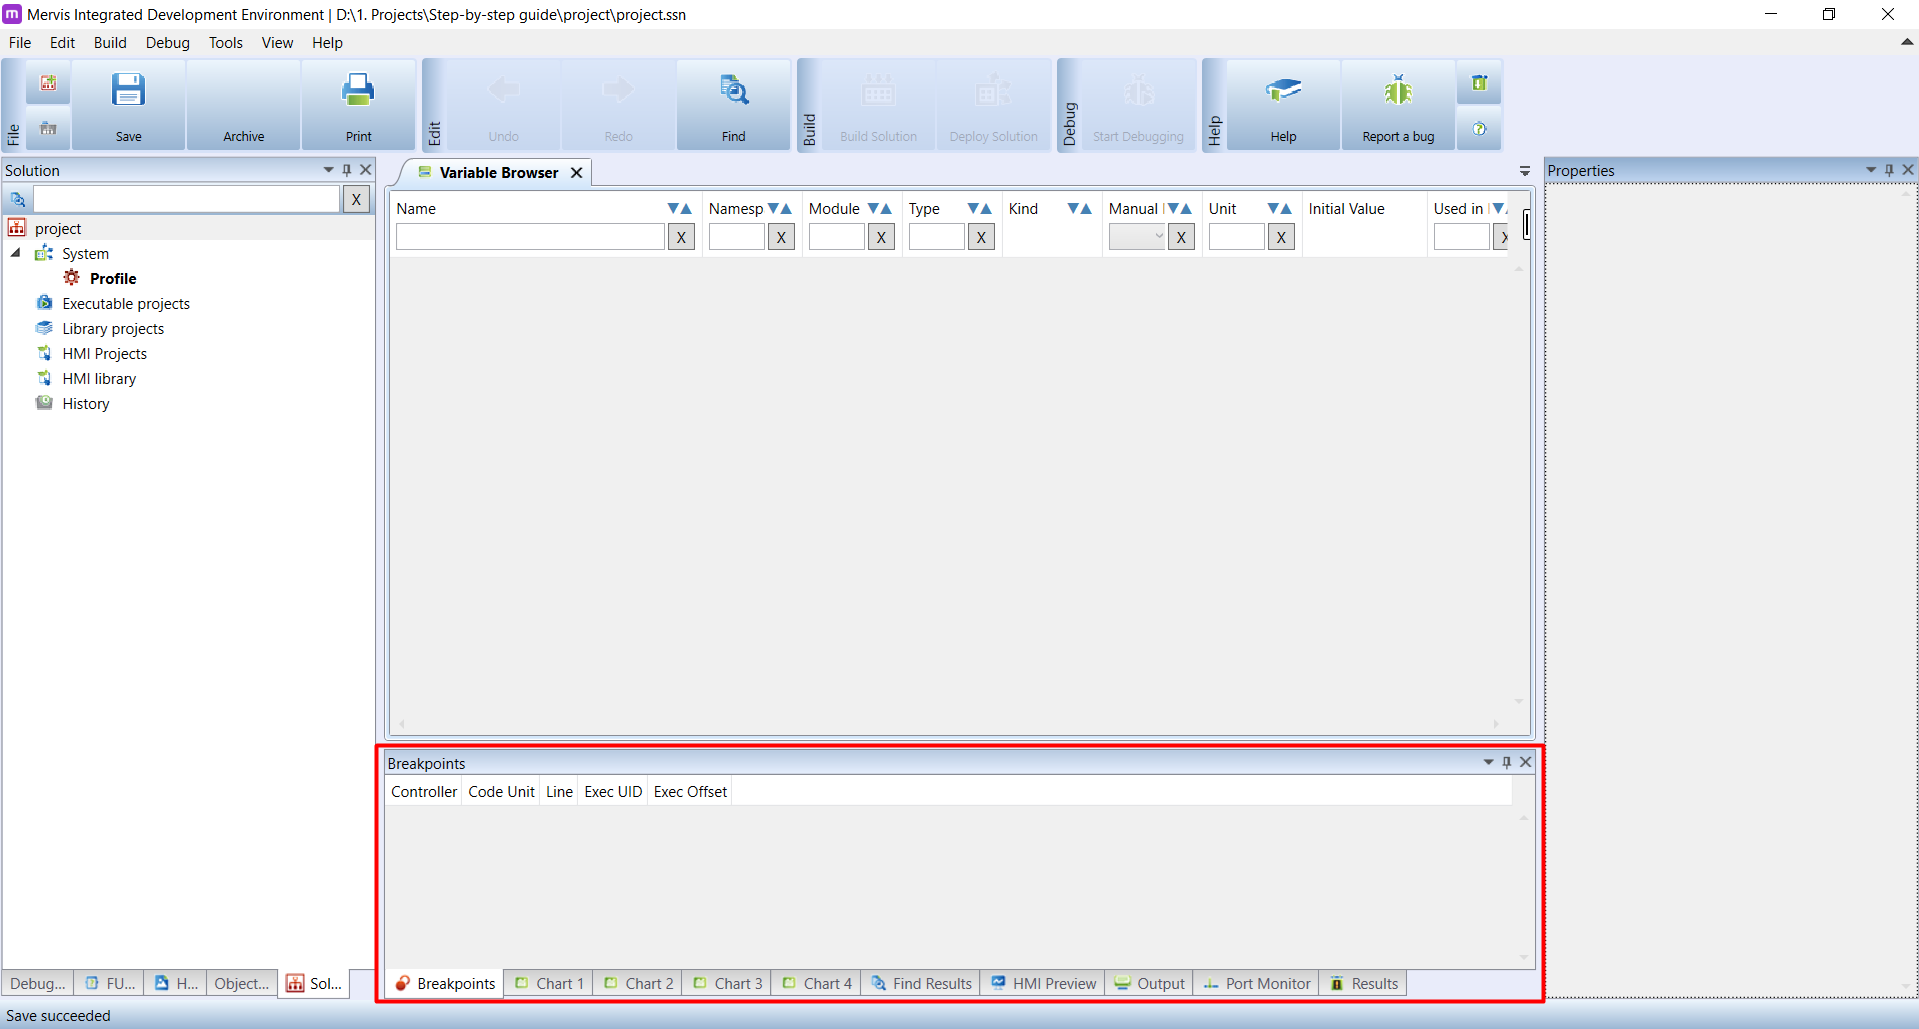
Another important part of Mervis IDE is placed below the main window - in this tutorial, we will call it Lower panel. It also features a lot of fixed tabs placed on its bottom edge. It is worth mentioning the Results and Output tabsused, for example, for compilation control, Chart for graphing the values of variables and also the Port monitor tab for viewing communication on a given channel.
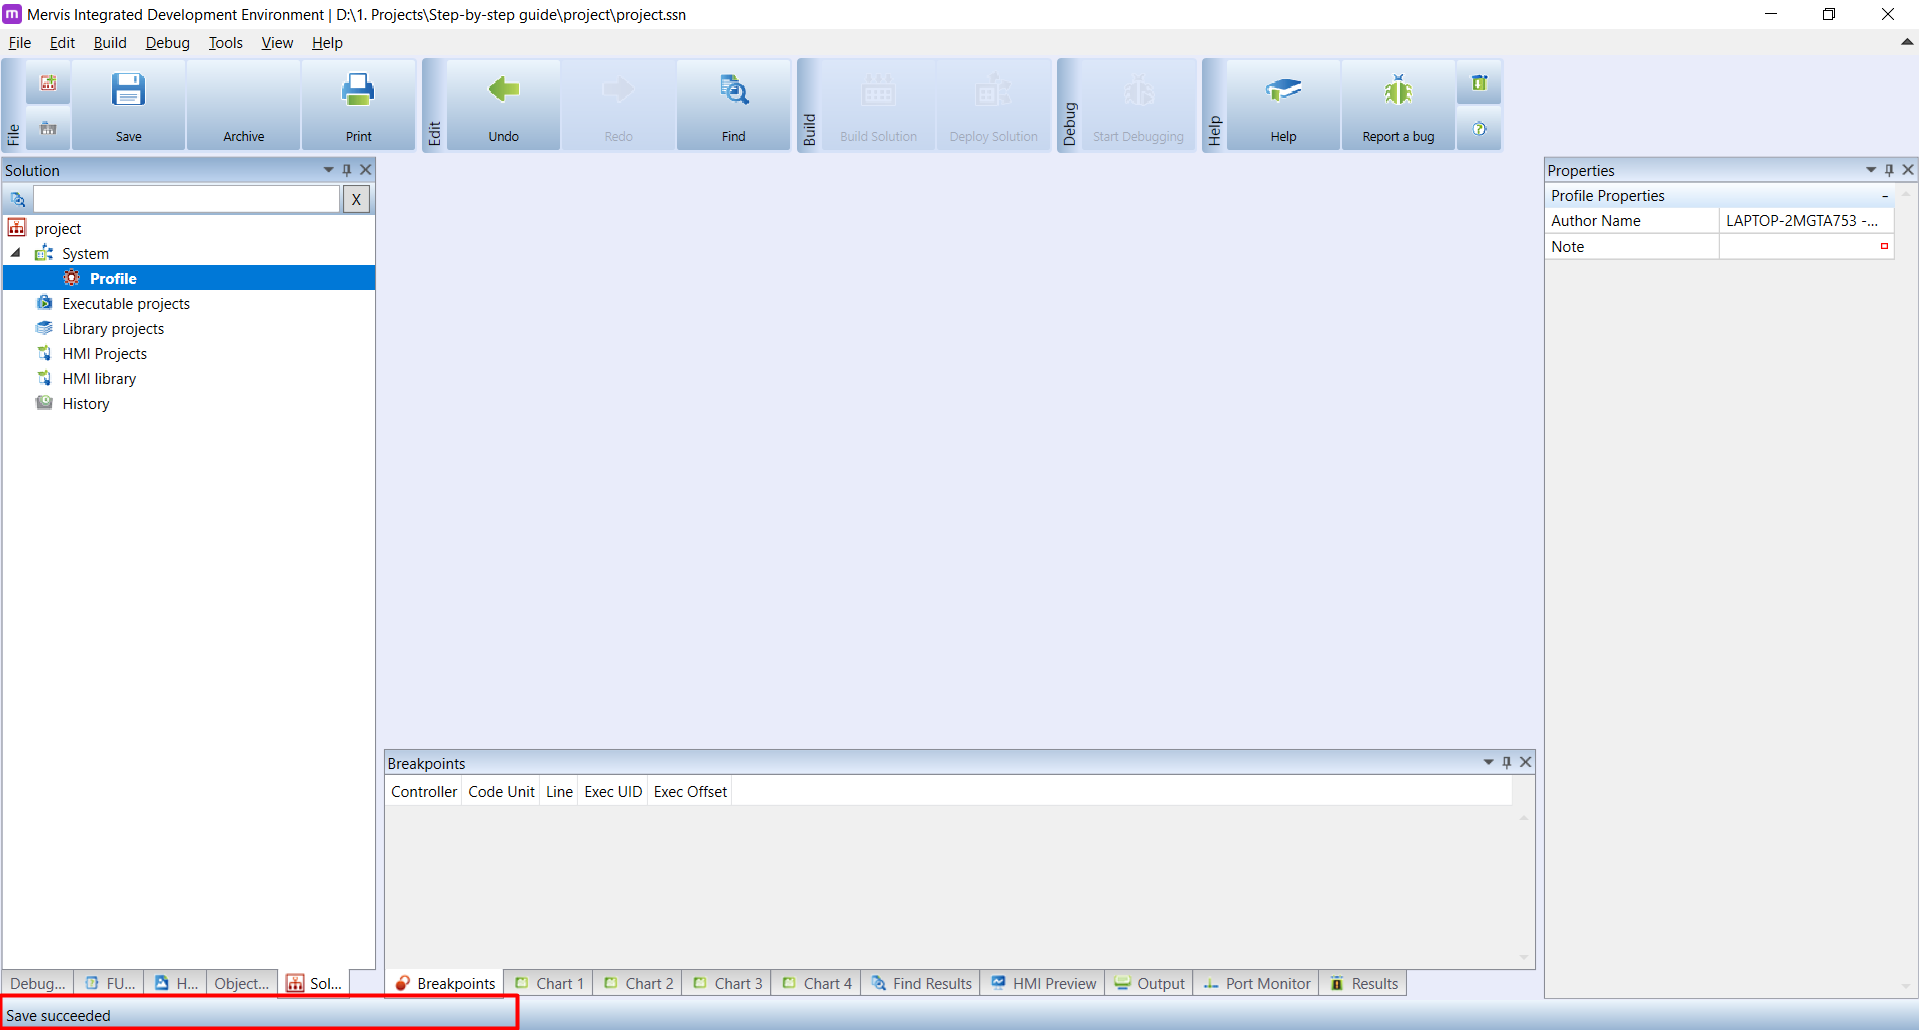
The last, but also very important component is the Status Bar. Many actions in Mervis IDE do not display any messages upon their finish and their outputs are displayed only in the status bar. In such cases, the bar displays Save succeeded message referring to a successful saving of the project.