This is an old revision of the document!
Storing data into Mervis DB
In this tutorial, we are going to demonstrate how to use cloud-based Mervis DB for long-term storing of data from UniPi controllers running Mervis.
Prerequisites
- UniPi controller running Mervis OS
- Temperature regulator project from the Attaching 1-Wire devices tutorial.
- 24V power supply
- 1-Wire temperature sensor
In this tutorial, we will use Unipi Neuron L523.
Setting the storage
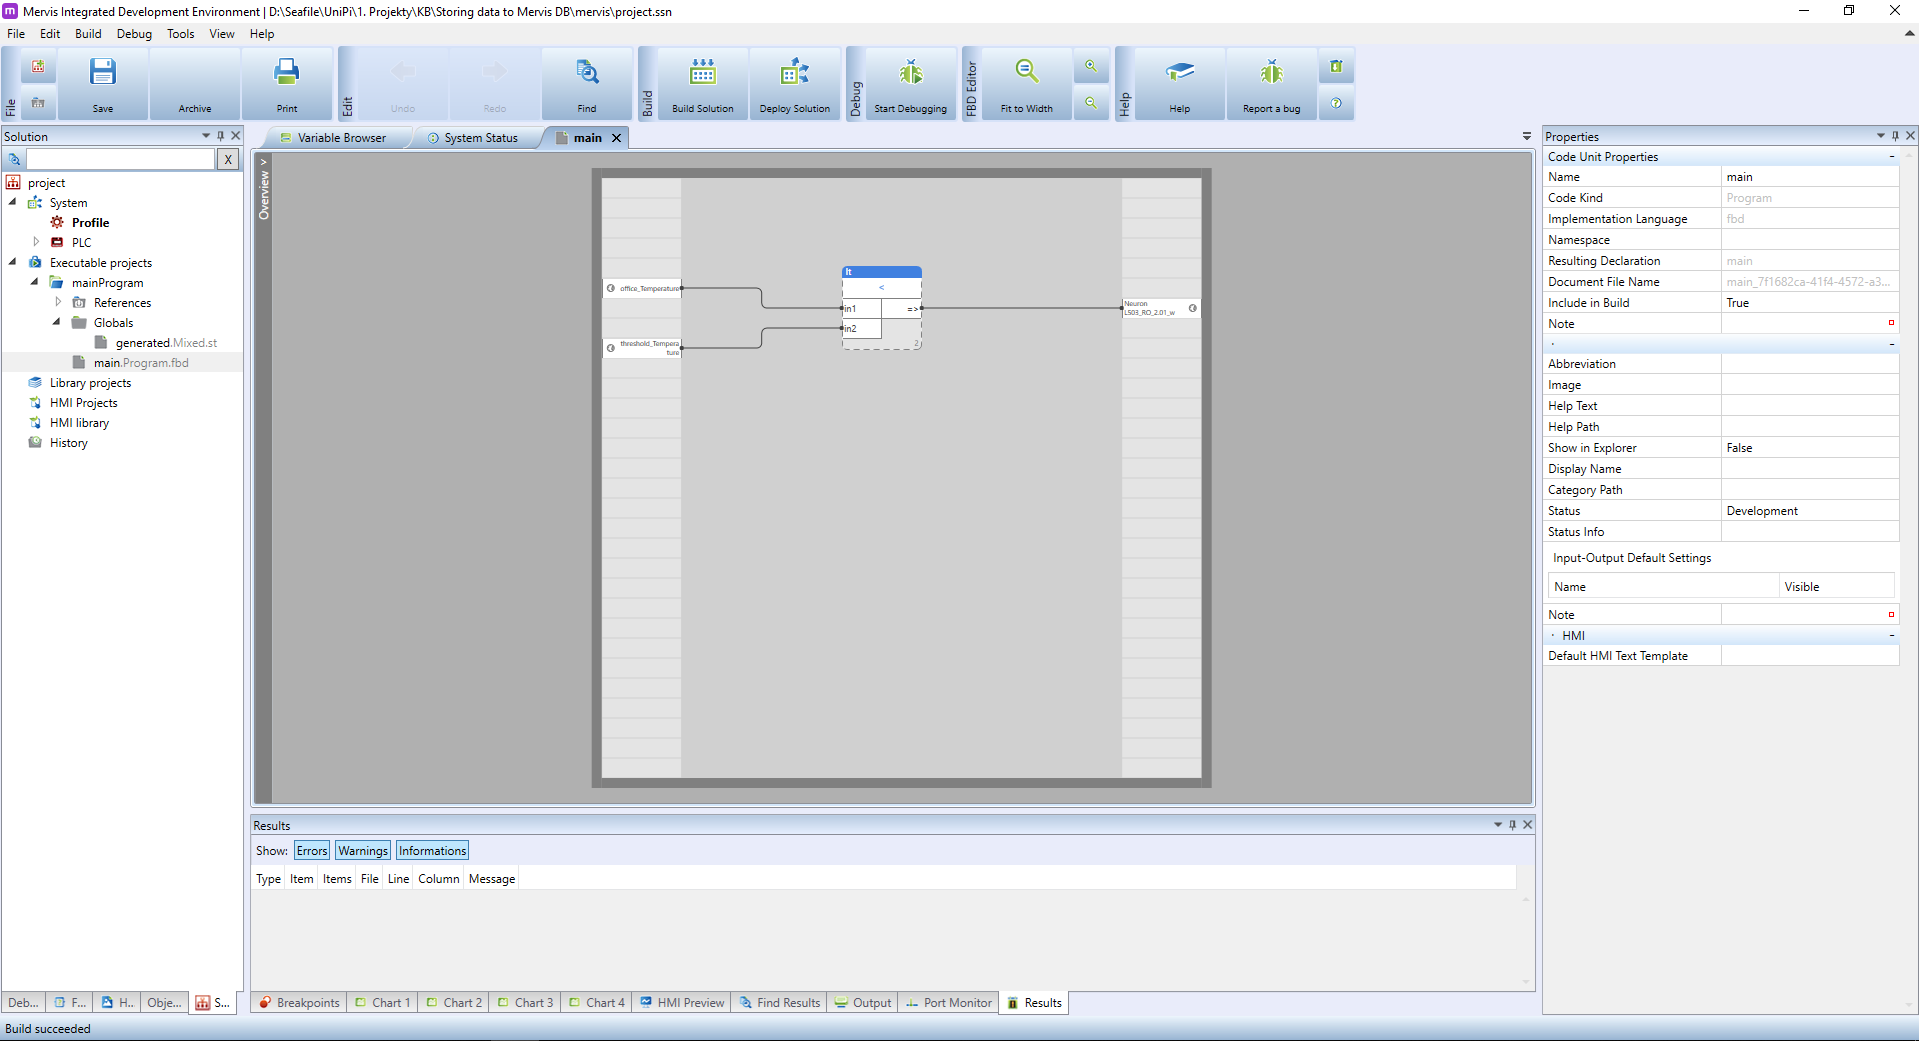
If you followed the Prerequisites, your workspace should look like this:
First, we will configure the connection parameters to Mervis DB. Select the PLC in the Left panel.
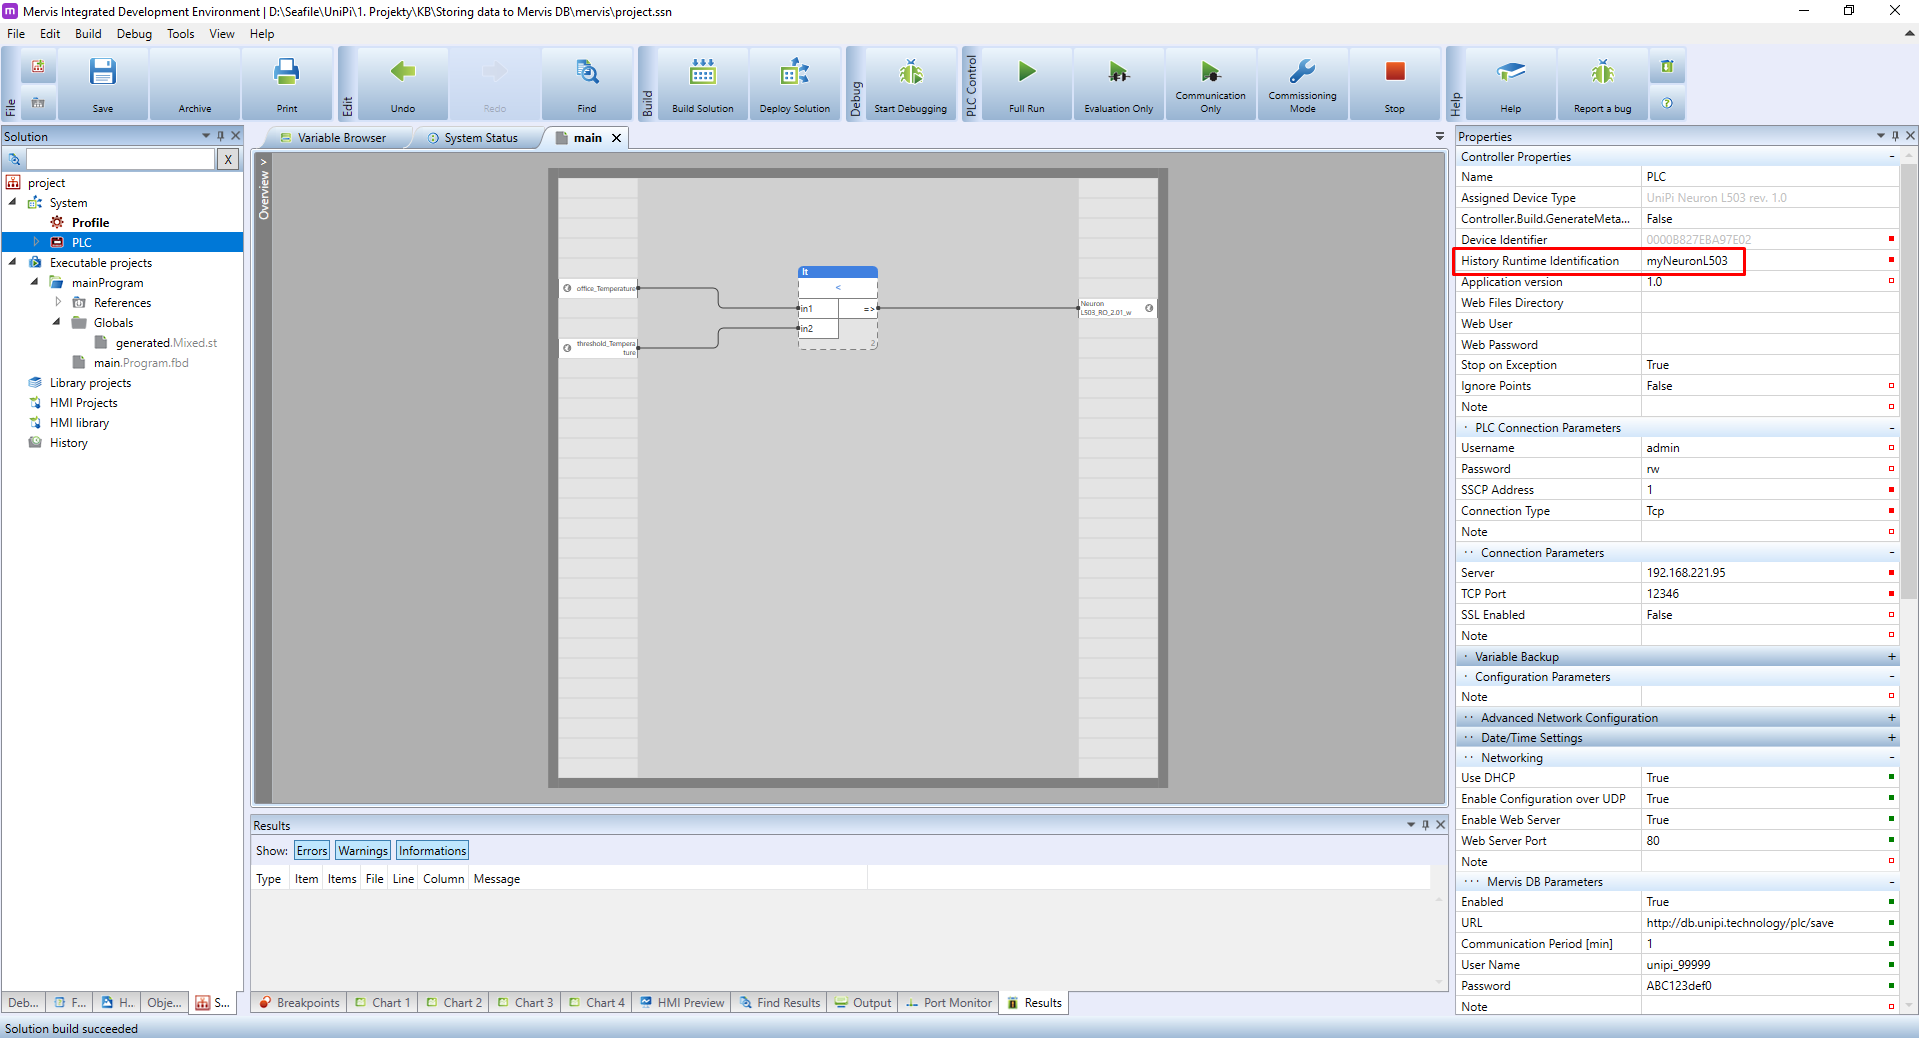
In the Properties panel you need to change the History Runtime Identification. This property is used as a name of the PLC for identification in the Mervis DB Viewer. Set it to something descriptive, e.g. location of the PLC or its function.
Lower in the PLC's properties is section Mervis DB Parameters. Set the values as follows:
- Enable: set to true to enable the logging
- URL: the URL of the Mervis DB service. For controllers running Mervis OS v2.3.0 or newer, use
https://db.unipi.technology/plc/save. For the rest, usehttp://db.unipi.technology/plc/save - Communication period [min]: this is the period in which the PLC will send the gathered data
- Certificate validation: set to
FALSEby default, more info in the Certificate validation - Username: the Mervis DB username you obtained from your account on unipi.technology
- Password: the Mervis DB password you obtained from your account on unipi.technology
Since we changed the configuration of the PLC, we need to upload it. Right click on the PLC in the Left panel and select the PLC Operation → PLC Setup → Upload configuration. If you are not sure, check out the Uploading a RunTime configuration tutorial.
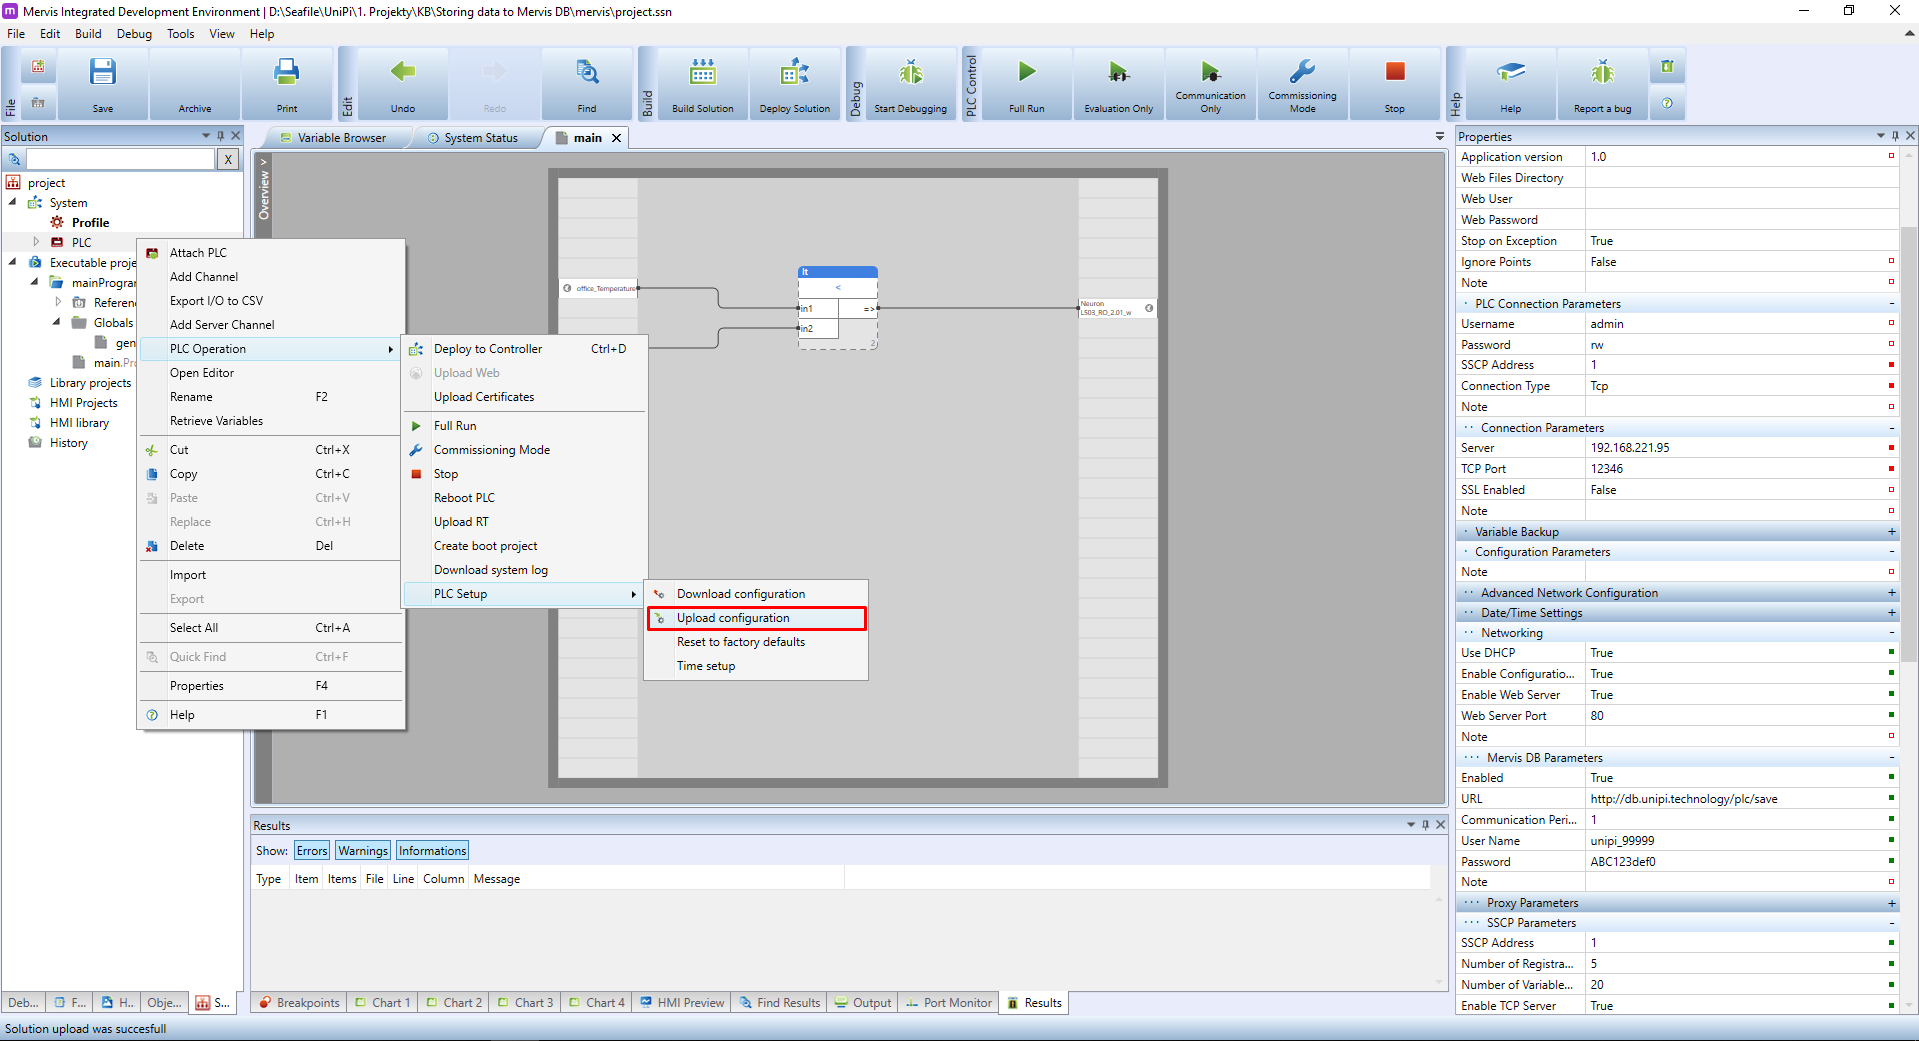
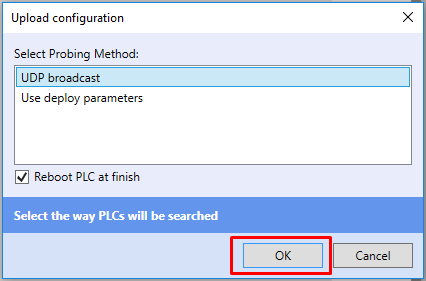
You will be asked how to connect to the PLC. If you are on the same network, you can select UDP Broadcast, otherwise use the Deploy parameters and confirm by clicking on OK.
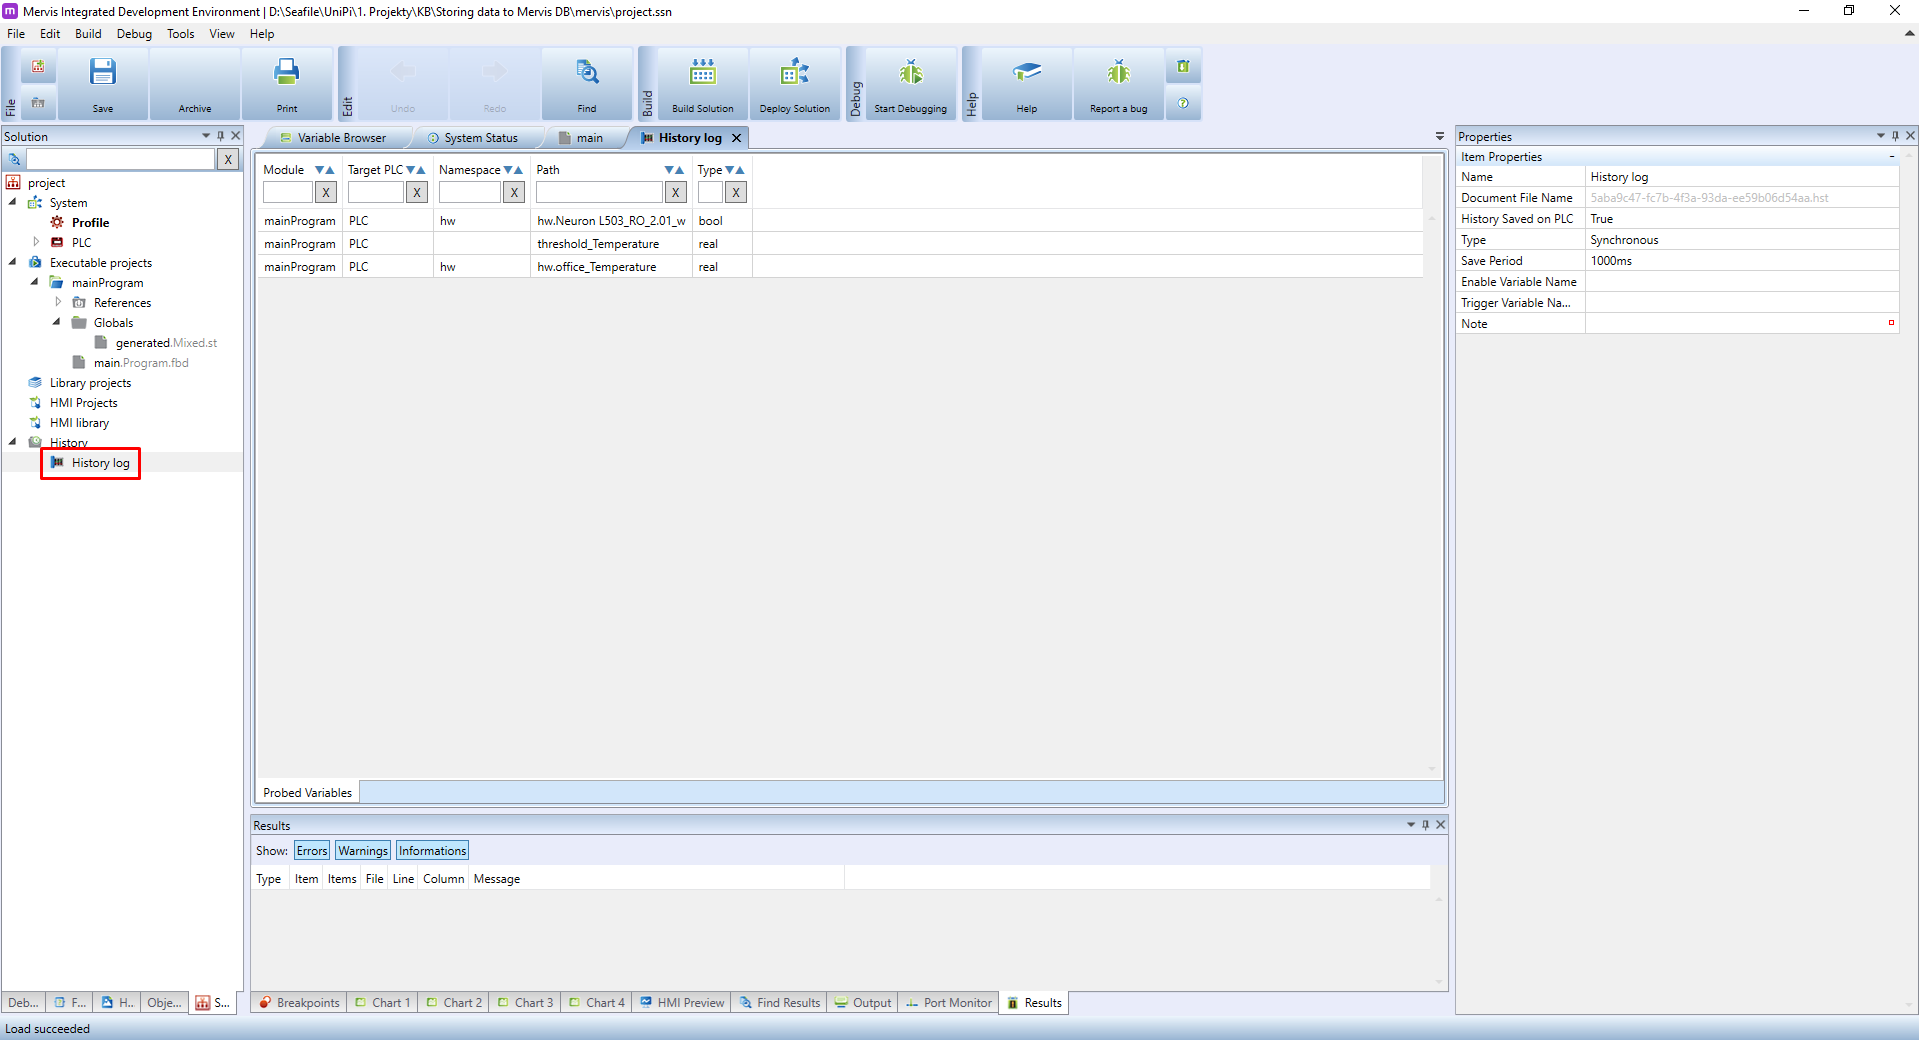
Next we need to define a History log into which we will set variables for storing. In the Left panel right click on the History and from the context menu select the Add New History.
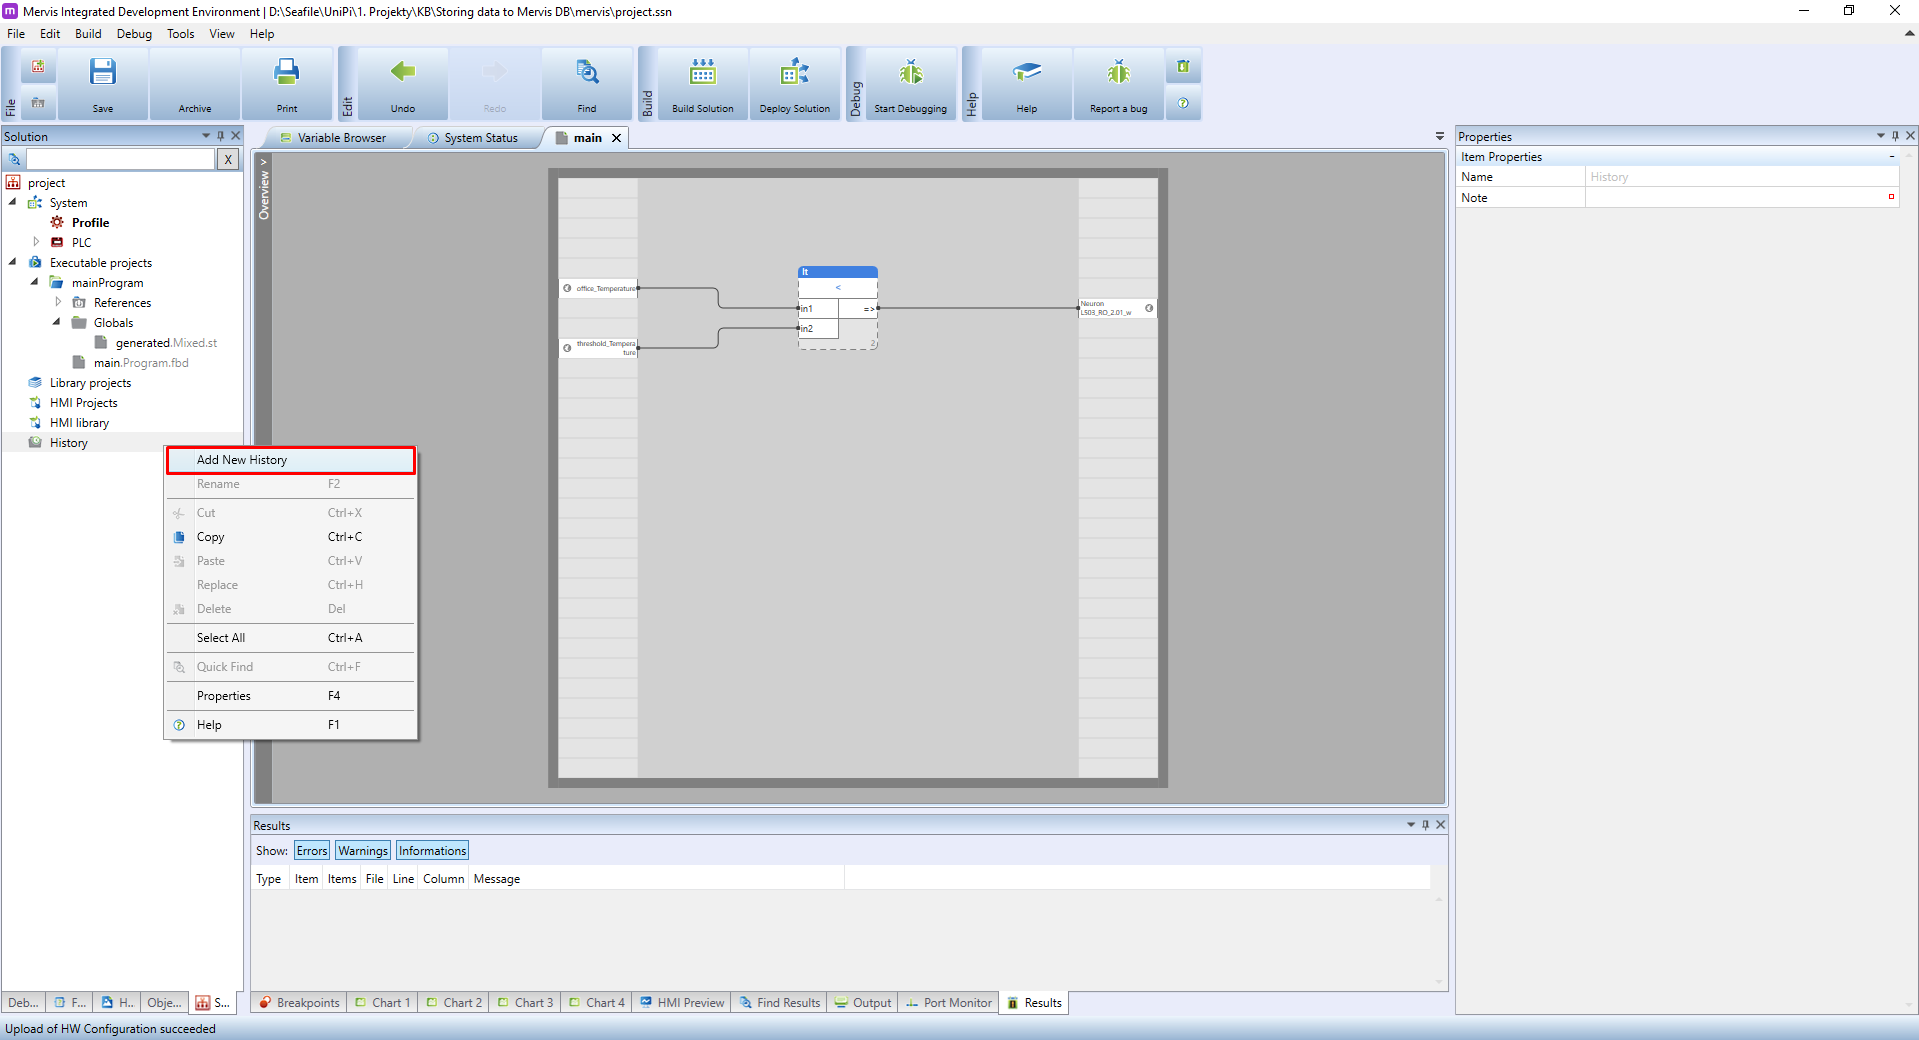
A new History log will appear under the History in the Left panel. Select it a move over to the Properties panel.
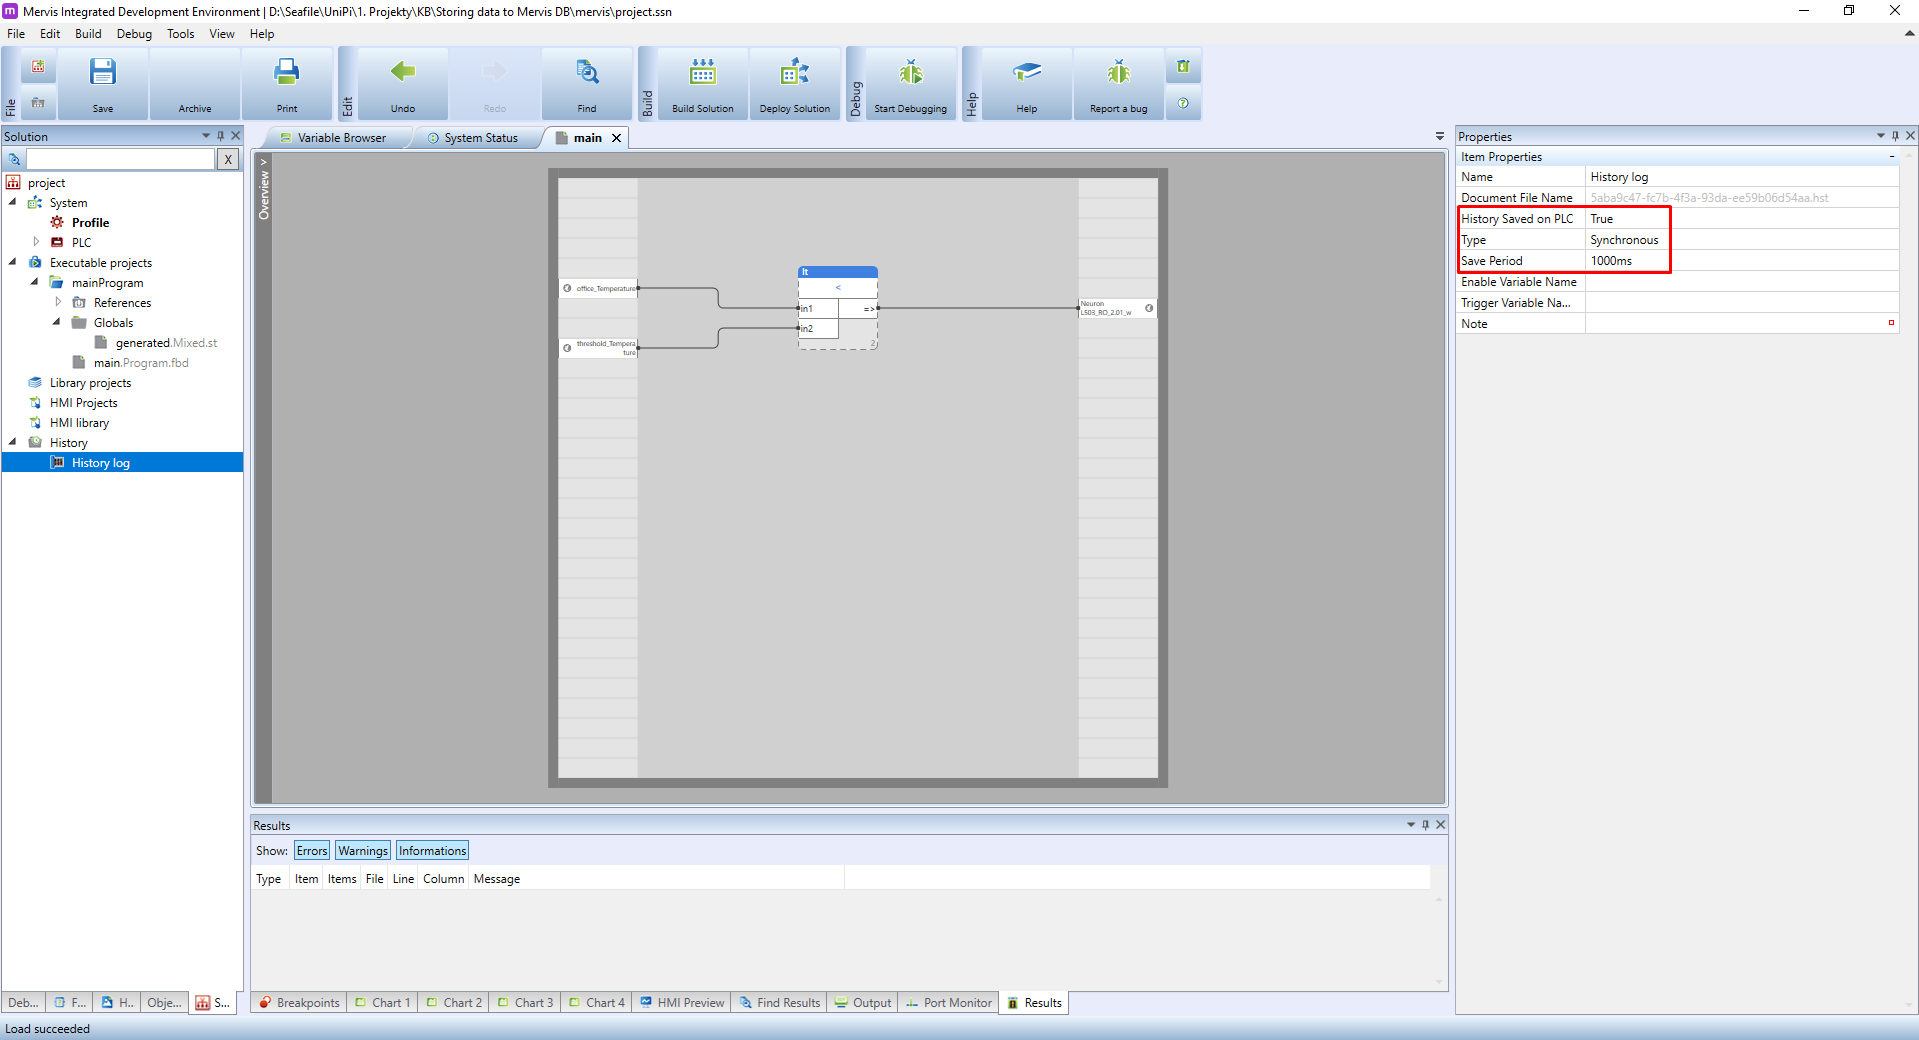
Change the History log properties accordingly:
- History Saved on PLC: enable the saving of this log by setting the value to
true - Type: set to
Synchronous - Save Period: this will set the period of saving the variable values for this History log.
As you can see, we already configured two different time period parameters: The Communication Period in PLC's properties and the Save Period in the History's log. So what is the difference between them?
The Save Period defines how often the PLC will sample variable values. The Communication Period is how often the PLC will send those samples to the Mervis DB.
We defined the History log and now we can add some variables to it. In the Main window you should see the main program canvas. Simply right-click on the office_Temperature global variable and in the context menu click on the Add to History. A similar method can be used to add variables into history directly from the Variable Browser.
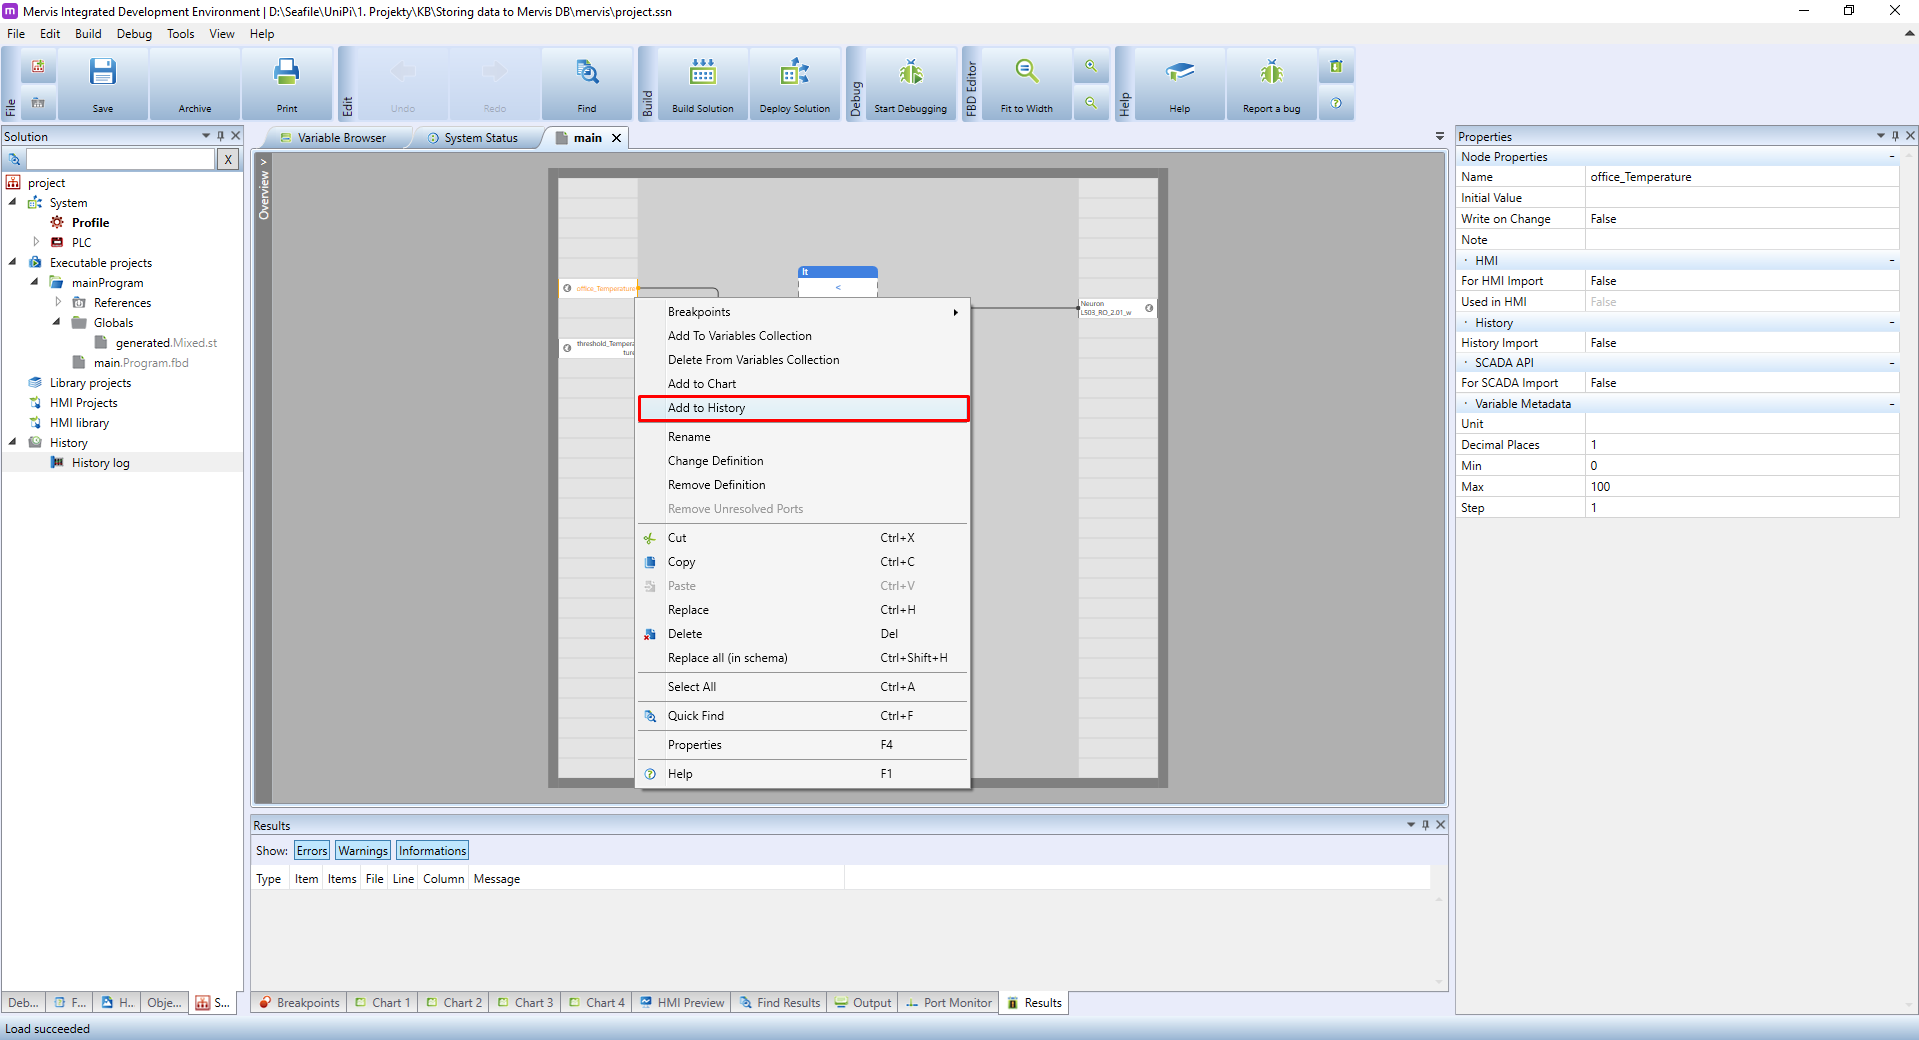
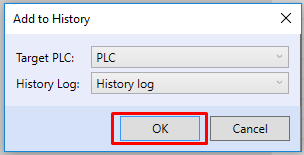
A Add to History dialog will appear. Select the correct history log and click on OK.
And repeat the process for the rest of the variables. After you finish, double click on the history log in the Left panel. A complete list of variables assigned to the history log will appear as a new tab in the Main window.
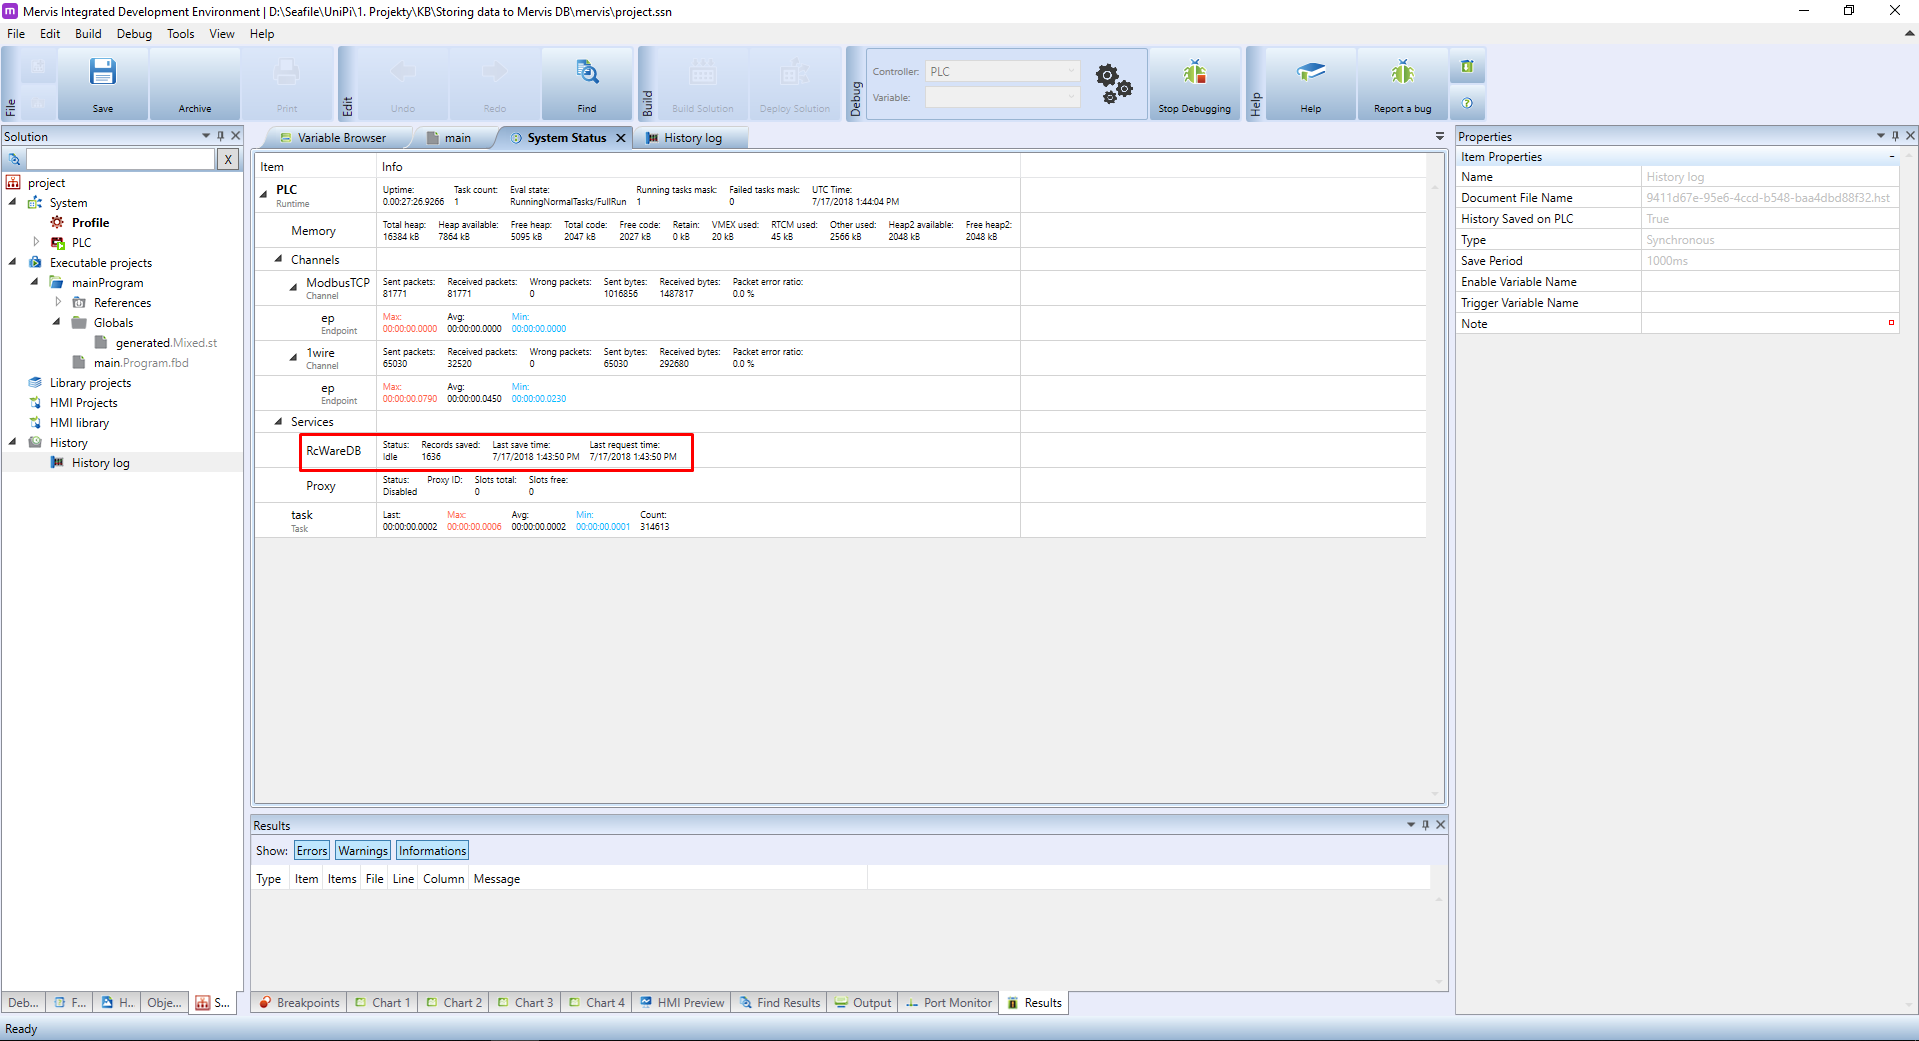
Deploy the solution, switch to Debugging mode and open the System status tab in the Main window. In the MervisDB (for older IDE RcWareDB ) section you can check, whether the communication of the PLC with Mervis DB works. If you left the Communication Period [min] set to 1 minute, the Records saved will increase each minute.
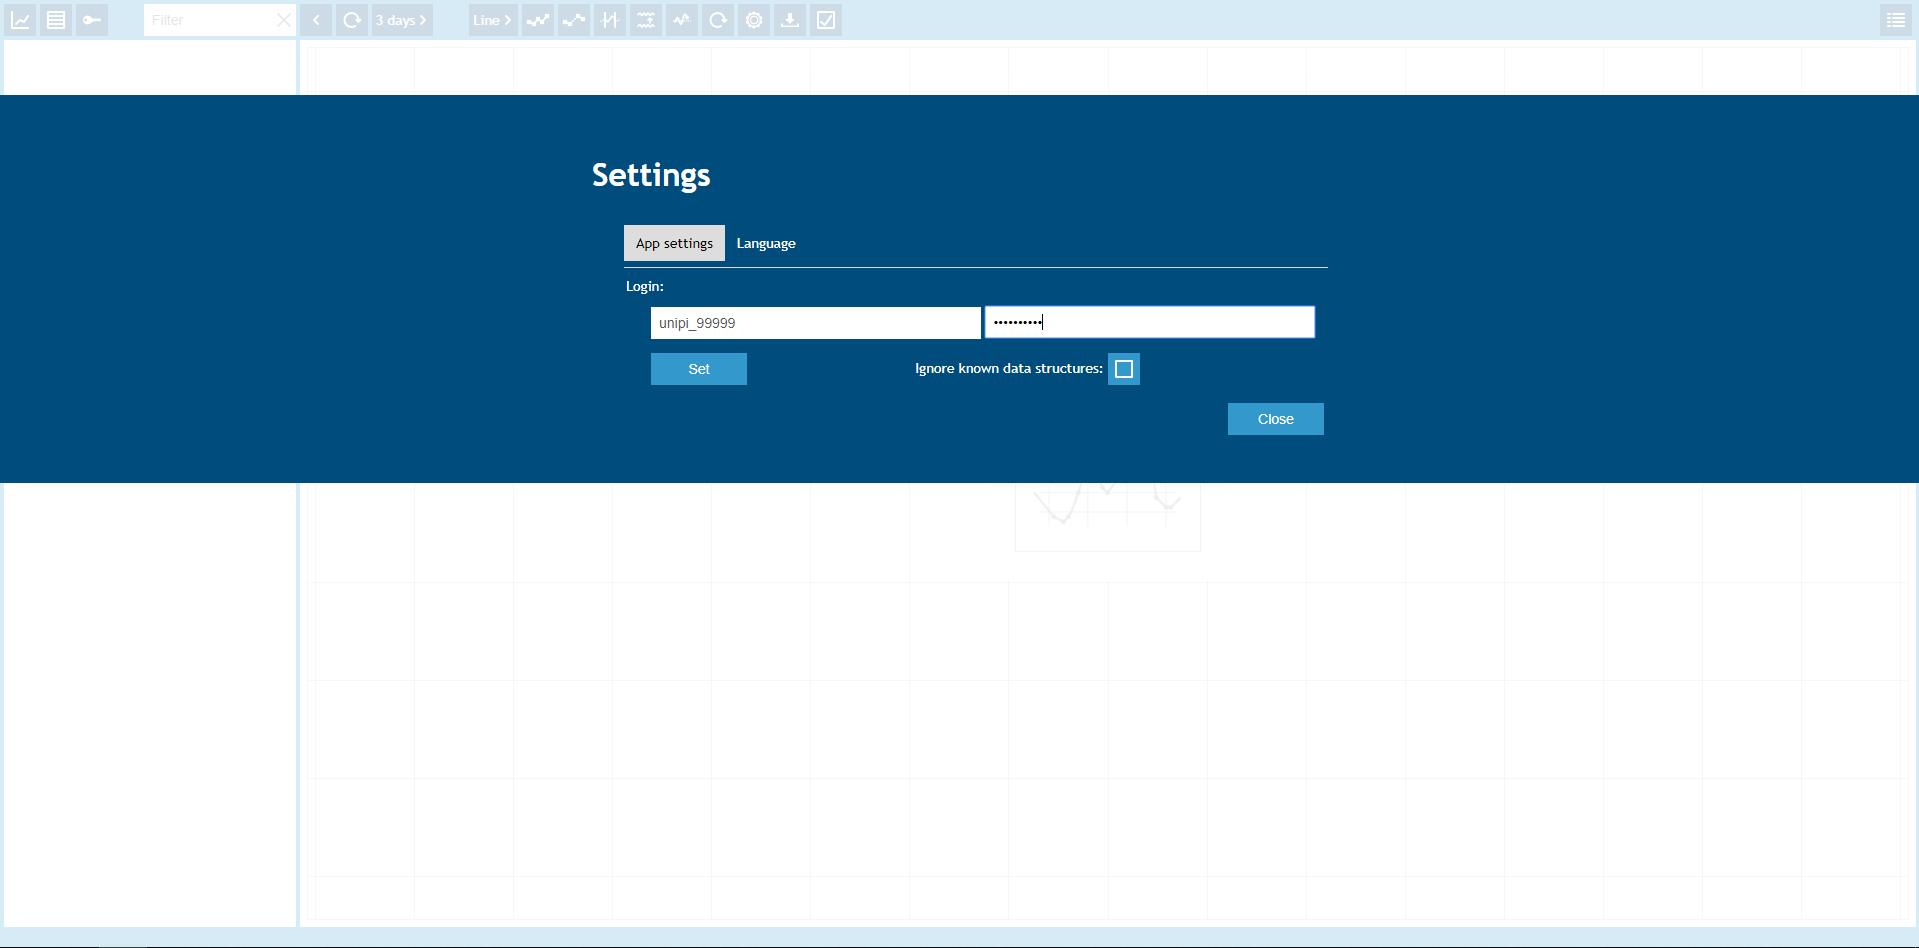
Now to the Mervis DB Viewer - a web-based tool for analyzing the data saved by PLCs. Open the web browser and enter the address https://db.unipi.technology/viewer. You will be presented with the login screen, where you have to enter the same credentials you used in the PLC's settings. After filling the username and password, click on Set and then on Close.
You will be presented with the Mervis DB web interface. In the Left panel, you should see a device with the name you set as the History Runtime Identification. Click on it and you should see a list of variables you set to the History log. Select all of them and their values will be automatically charted.
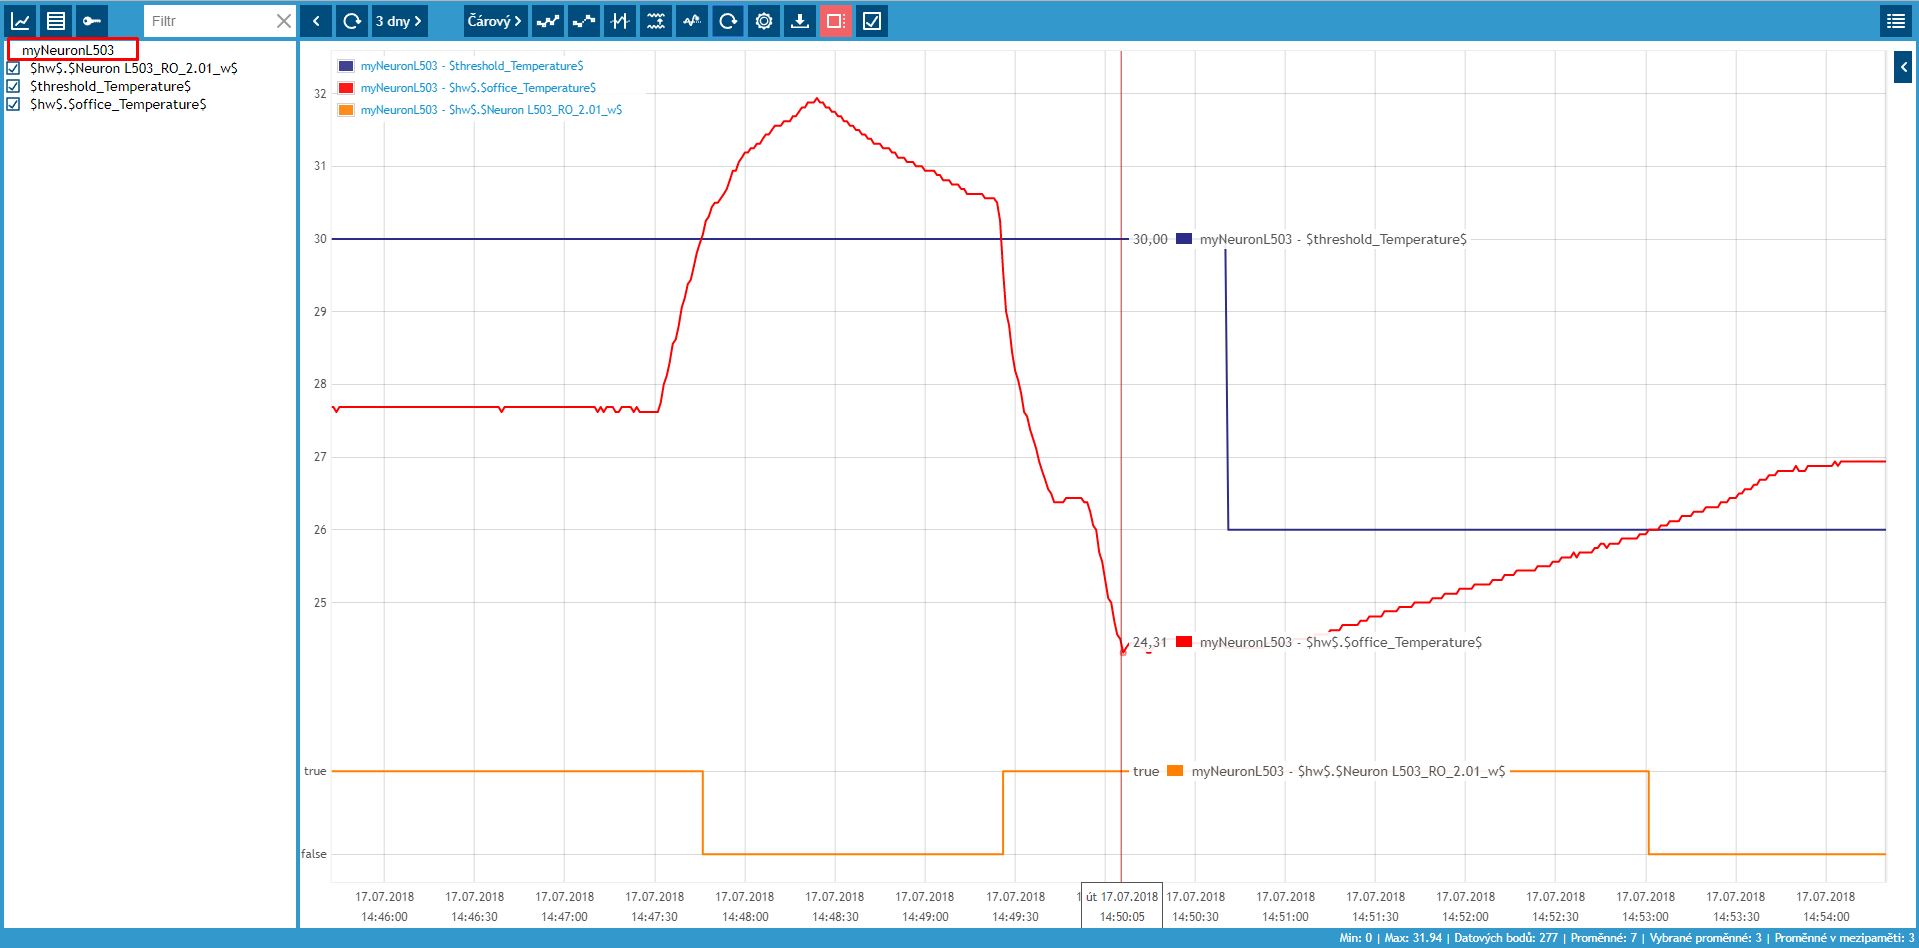
You can visually check that our simple temperature regulation works. You can use the mouse cursor to check the values of the charted data, set different chart types and periods and so on.